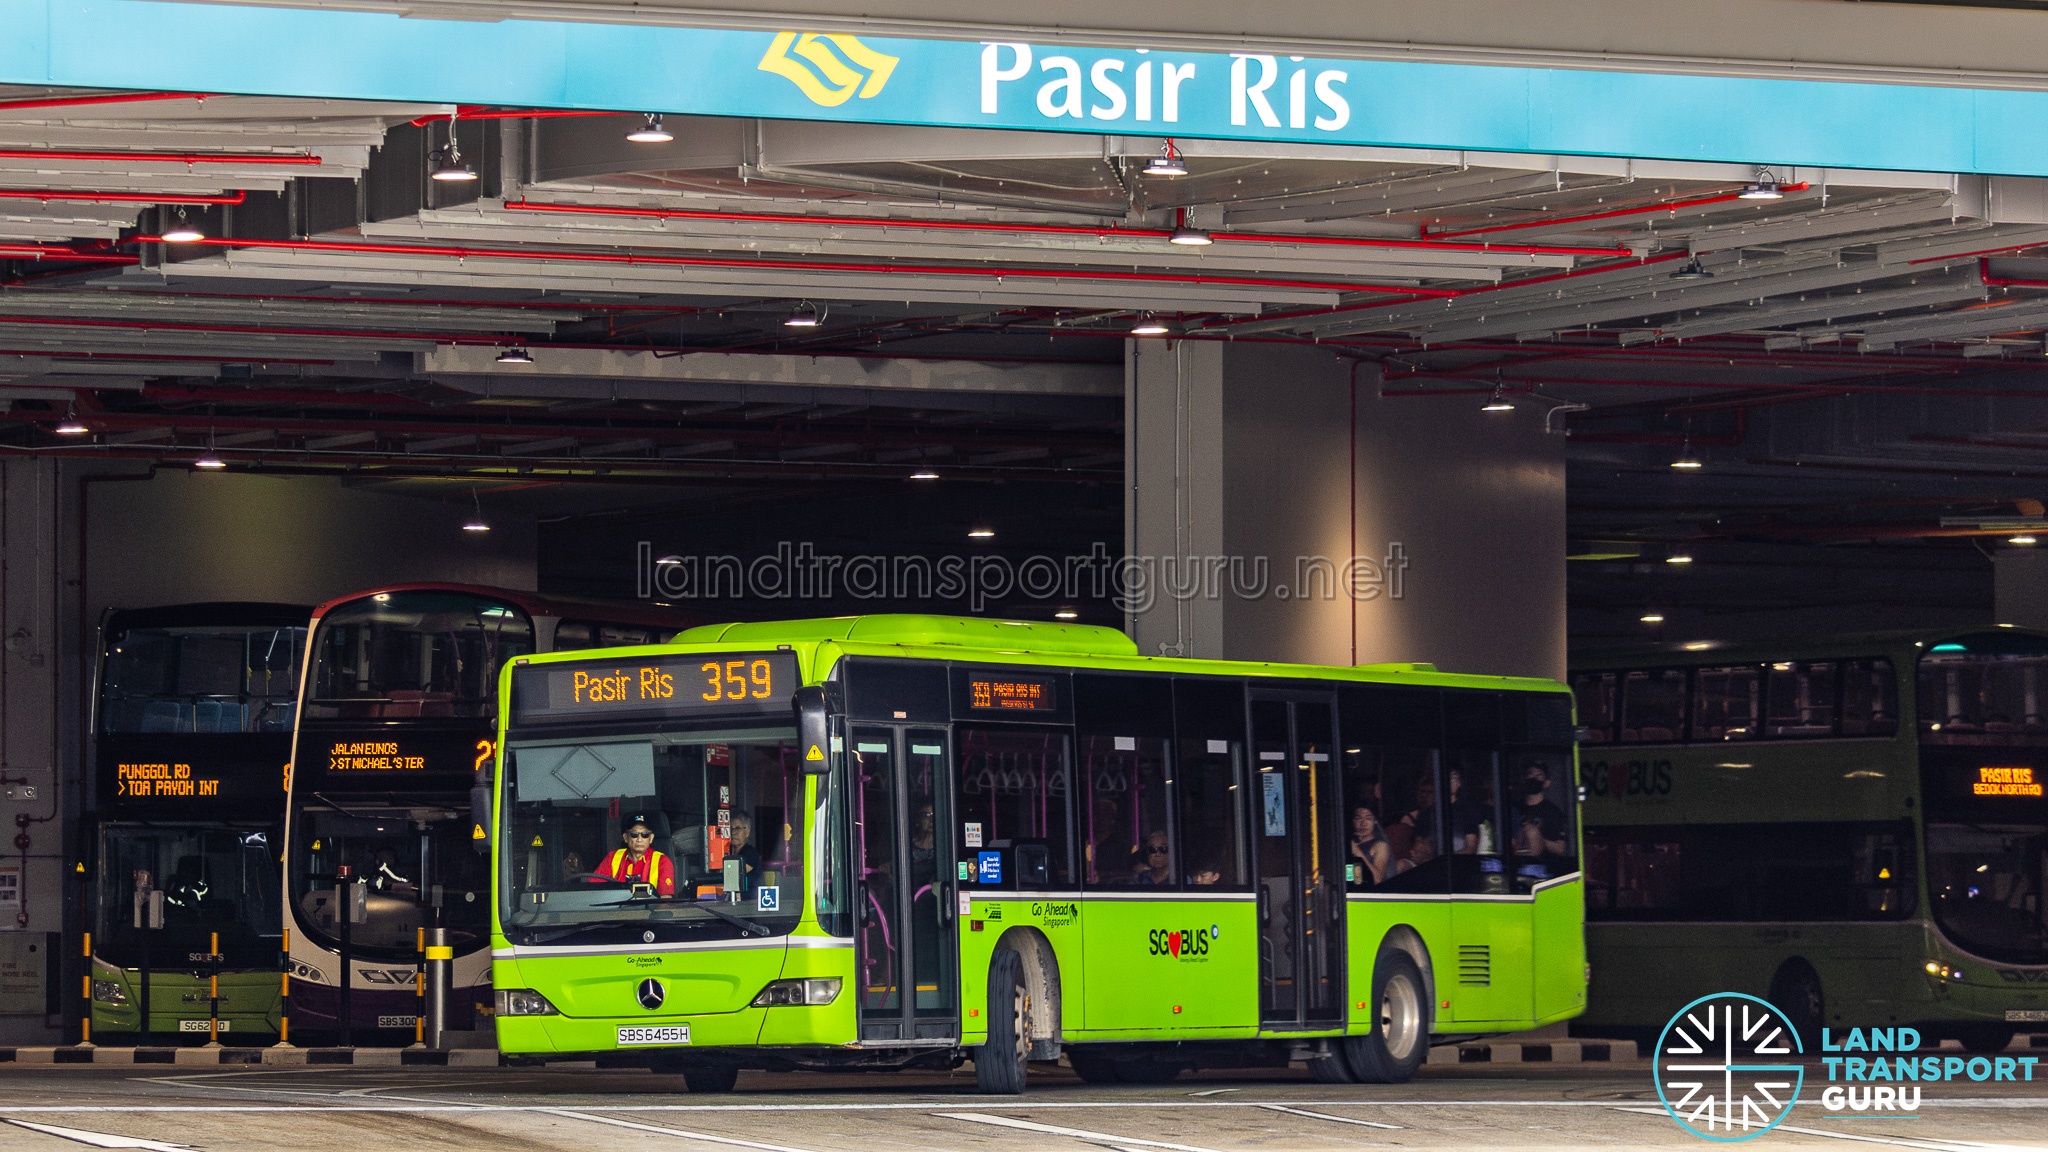
In October 2026, new details on Singapore’s Bus Contracting Model (BCM) were disclosed in several written parliamentary replies issued by the Ministry of Transport (MOT). These details cover the Loyang Bus Package, operator performance and reliability reporting.
We summarise the latest disclosures in this article, along with our opinions in the attached commentary.
1. Loyang Bus Package – Contract Extension


Workers’ Party NCMP Eileen Chong Pei Shan asked about the rules governing extensions beyond contractual options, the reasons for extending the Loyang Bus Package rather than retendering it, and the duration and fees of those extensions. [Link]
The package, operated by Go-Ahead Singapore, was the second bus package tendered under the BCM. MOT’s reply disclosed a further extension to 2030 and elaborated on how LTA assesses and approves contract extensions.
Loyang Bus Package
| Date / Milestone | Development — Loyang Bus Package (Contract PT201) | Contract Period |
| Sep 2016 | Go-Ahead Singapore commenced operations under the initial five-year contract. | Sep 2016 – Sep 2021 (5 years) |
| Aug 2020 | Go-Ahead Group announced a two-year extension, following LTA’s exercise of the contractual extension option. | Sep 2021 – Sep 2023 (2 years) |
| Sep–Oct 2022 | A further three-year extension first surfaced through a Go-Ahead Group staff member’s LinkedIn post in September. The Straits Times reported it on 31 October, following enquiries to LTA and the operator. LTA cited COVID-19’s impact on the tendering timeline. | Sep 2023 – Sep 2026 (3 years) |
| Oct 2026 | MOT disclosed a further extension to 2030 in a written parliamentary reply, aligning the contract with the planned relocation to Lorong Halus Bus Depot. | Sep 2026 – 2030 (approx. 4 years) |
While LTA had already cited COVID-19’s impact on the tendering timeline in 2022, the parliamentary reply provides a more specific explanation: market uncertainty could have led operators to price substantial risk premiums into their bids. The extension to 2030 would bring the contract’s total span to approximately 14 years, compared with its original five-year firm term and two-year extension option.
This disclosure history also highlights the limited proactive communication of these extensions. Details of the 2023–2026 extension emerged through a staff member’s LinkedIn post and subsequent media enquiries, with Go-Ahead Singapore later linking to the news report from its website’s press release section. The further extension to 2030 was disclosed through a parliamentary reply.
Contract Extensions
LTA had previously explained, in a December 2024 media response reported by The Straits Times, that decisions to extend bus contracts or conduct competitive tenders take into account prevailing market conditions and the impact on operations.
The October 2026 parliamentary reply elaborated on the approval process and considerations governing extensions:
- Contract extensions are governed by government procurement rules and require approval from the LTA Board.
- Extensions are offered only if the incumbent operator’s performance is satisfactory.
- Terms are renegotiated, taking into account prevailing operating costs and service fee benchmarks from comparable bus package contracts.
- Service standards are typically reviewed.
- Extension fees were not disclosed due to commercial sensitivity.
The reply also identified circumstances in which extensions may be appropriate:
- Spacing out tenders to ensure competitive bids;
- Aligning tender schedules with relocations to new depots; and
- Responding to extenuating circumstances, such as the COVID-19 pandemic.
Commentary: An incomplete picture of BCM contract extensions
As outlined in our previous article, Singapore’s Bus Contracting Model, Ten Years On, the criteria for LTA pursuing contract extensions are not sufficiently transparent. This October 2026 disclosure sheds more light on LTA’s considerations in granting extensions, but leaves some questions unanswered.
MOT cited spacing out tenders as one reason for extending contracts. LTA has also tendered packages together under PT217 (Bulim and Sembawang–Yishun) and PT218 (Bukit Merah and Jurong West), with most bidders offering lower combined prices than the sum of their separate bids. These examples show that joint tendering can offer potential savings, but the reply does not explain how LTA weighs these opportunities against the benefits of spacing out tenders.
MOT also cited aligning tenders with relocations to new depots. The Serangoon–Eunos Bus Package will begin its new tendered term from Kim Chuan Bus Depot in June 2027. However, depot relocations have also proceeded under existing negotiated contracts, as the following examples show:
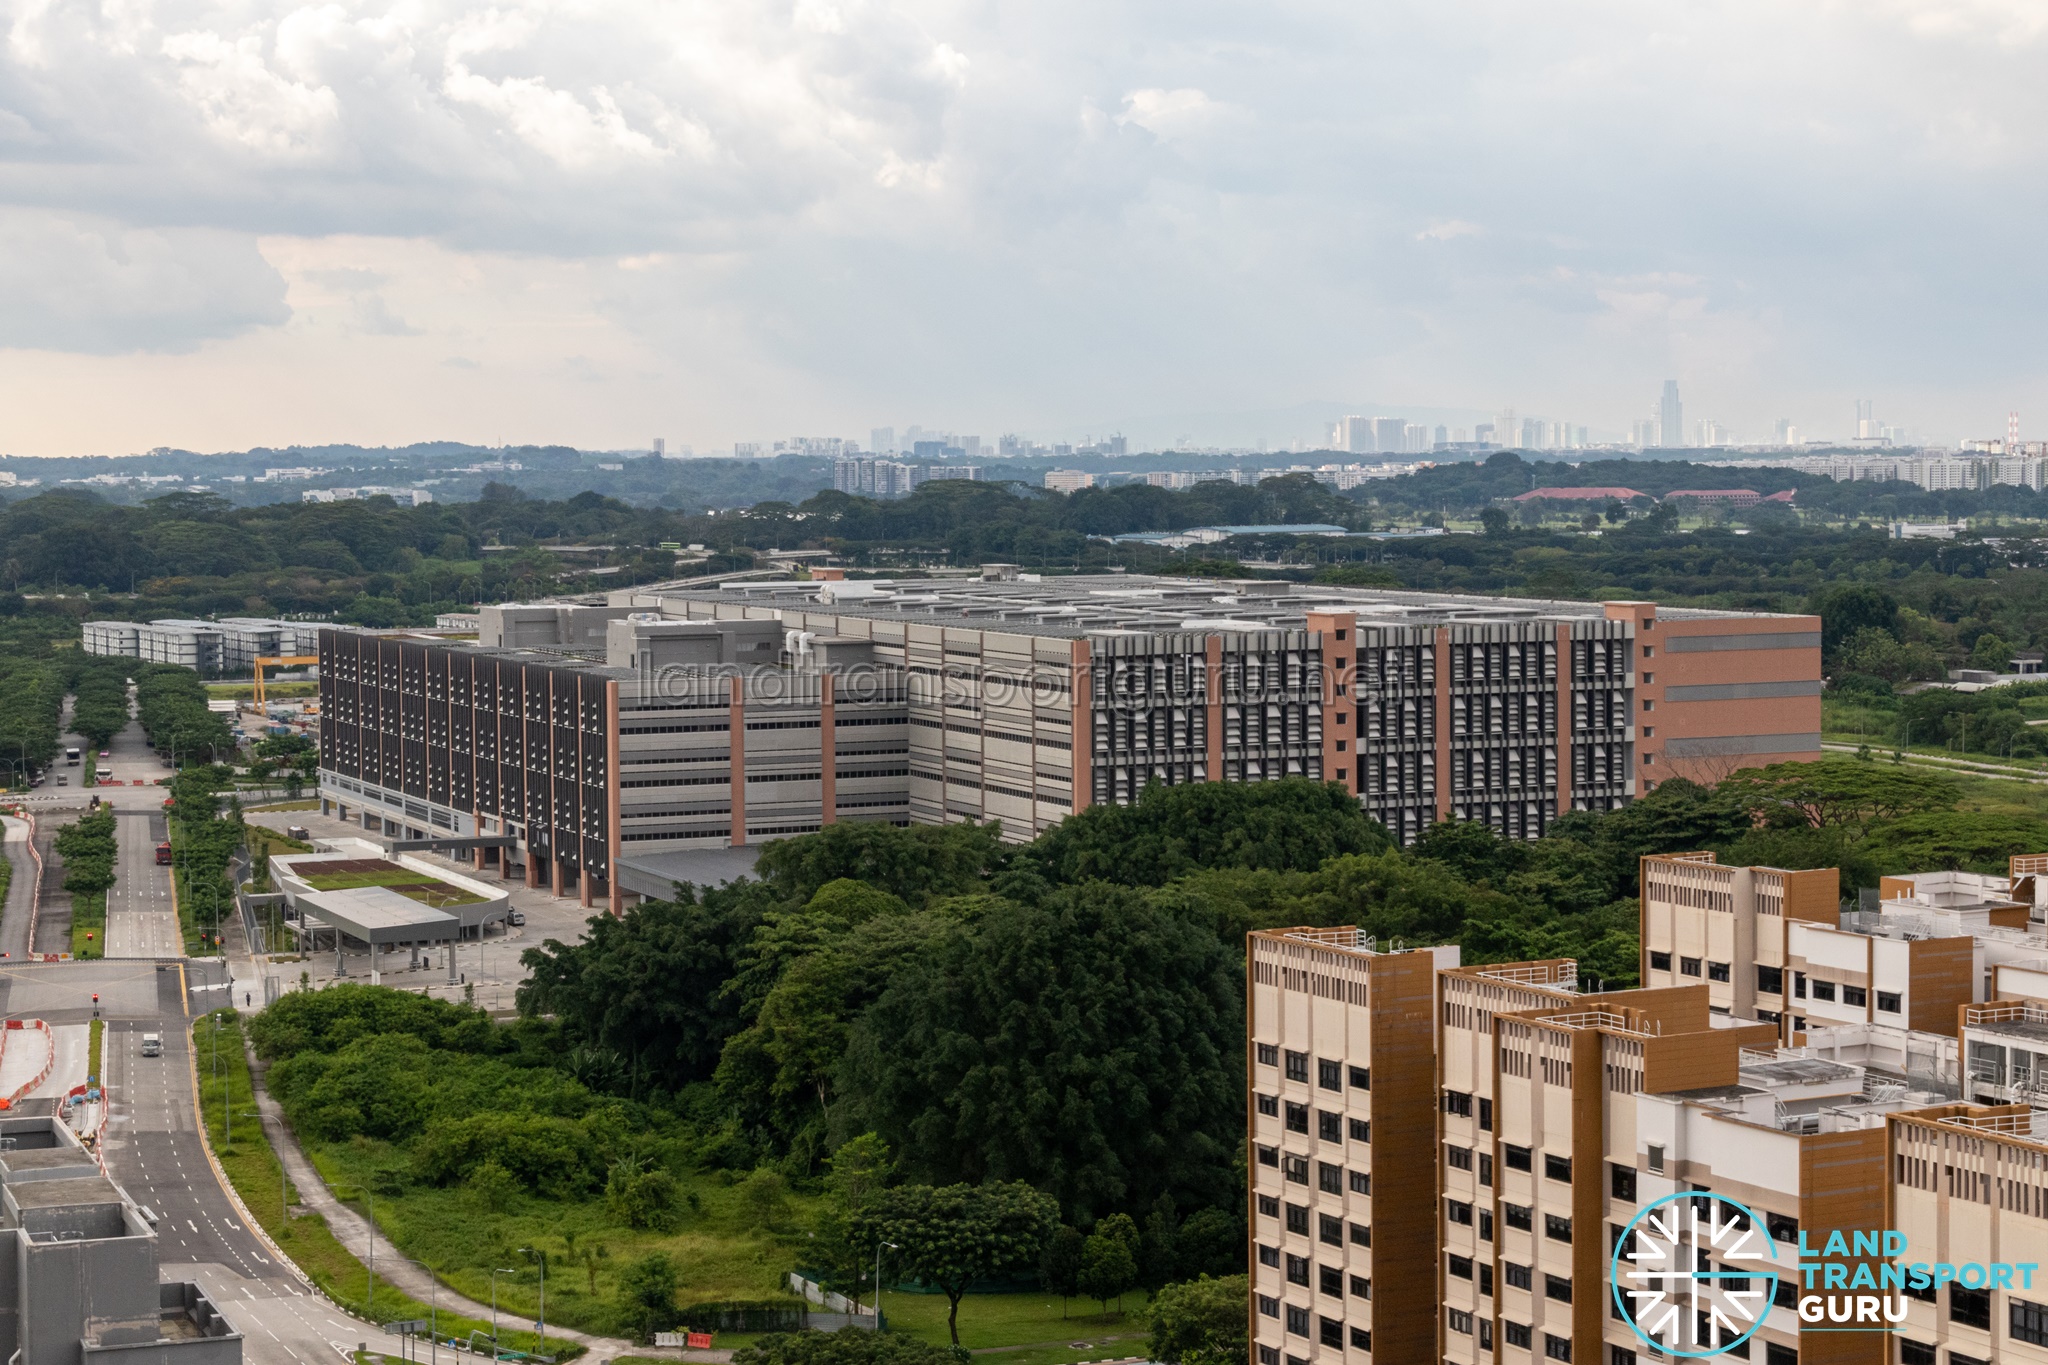
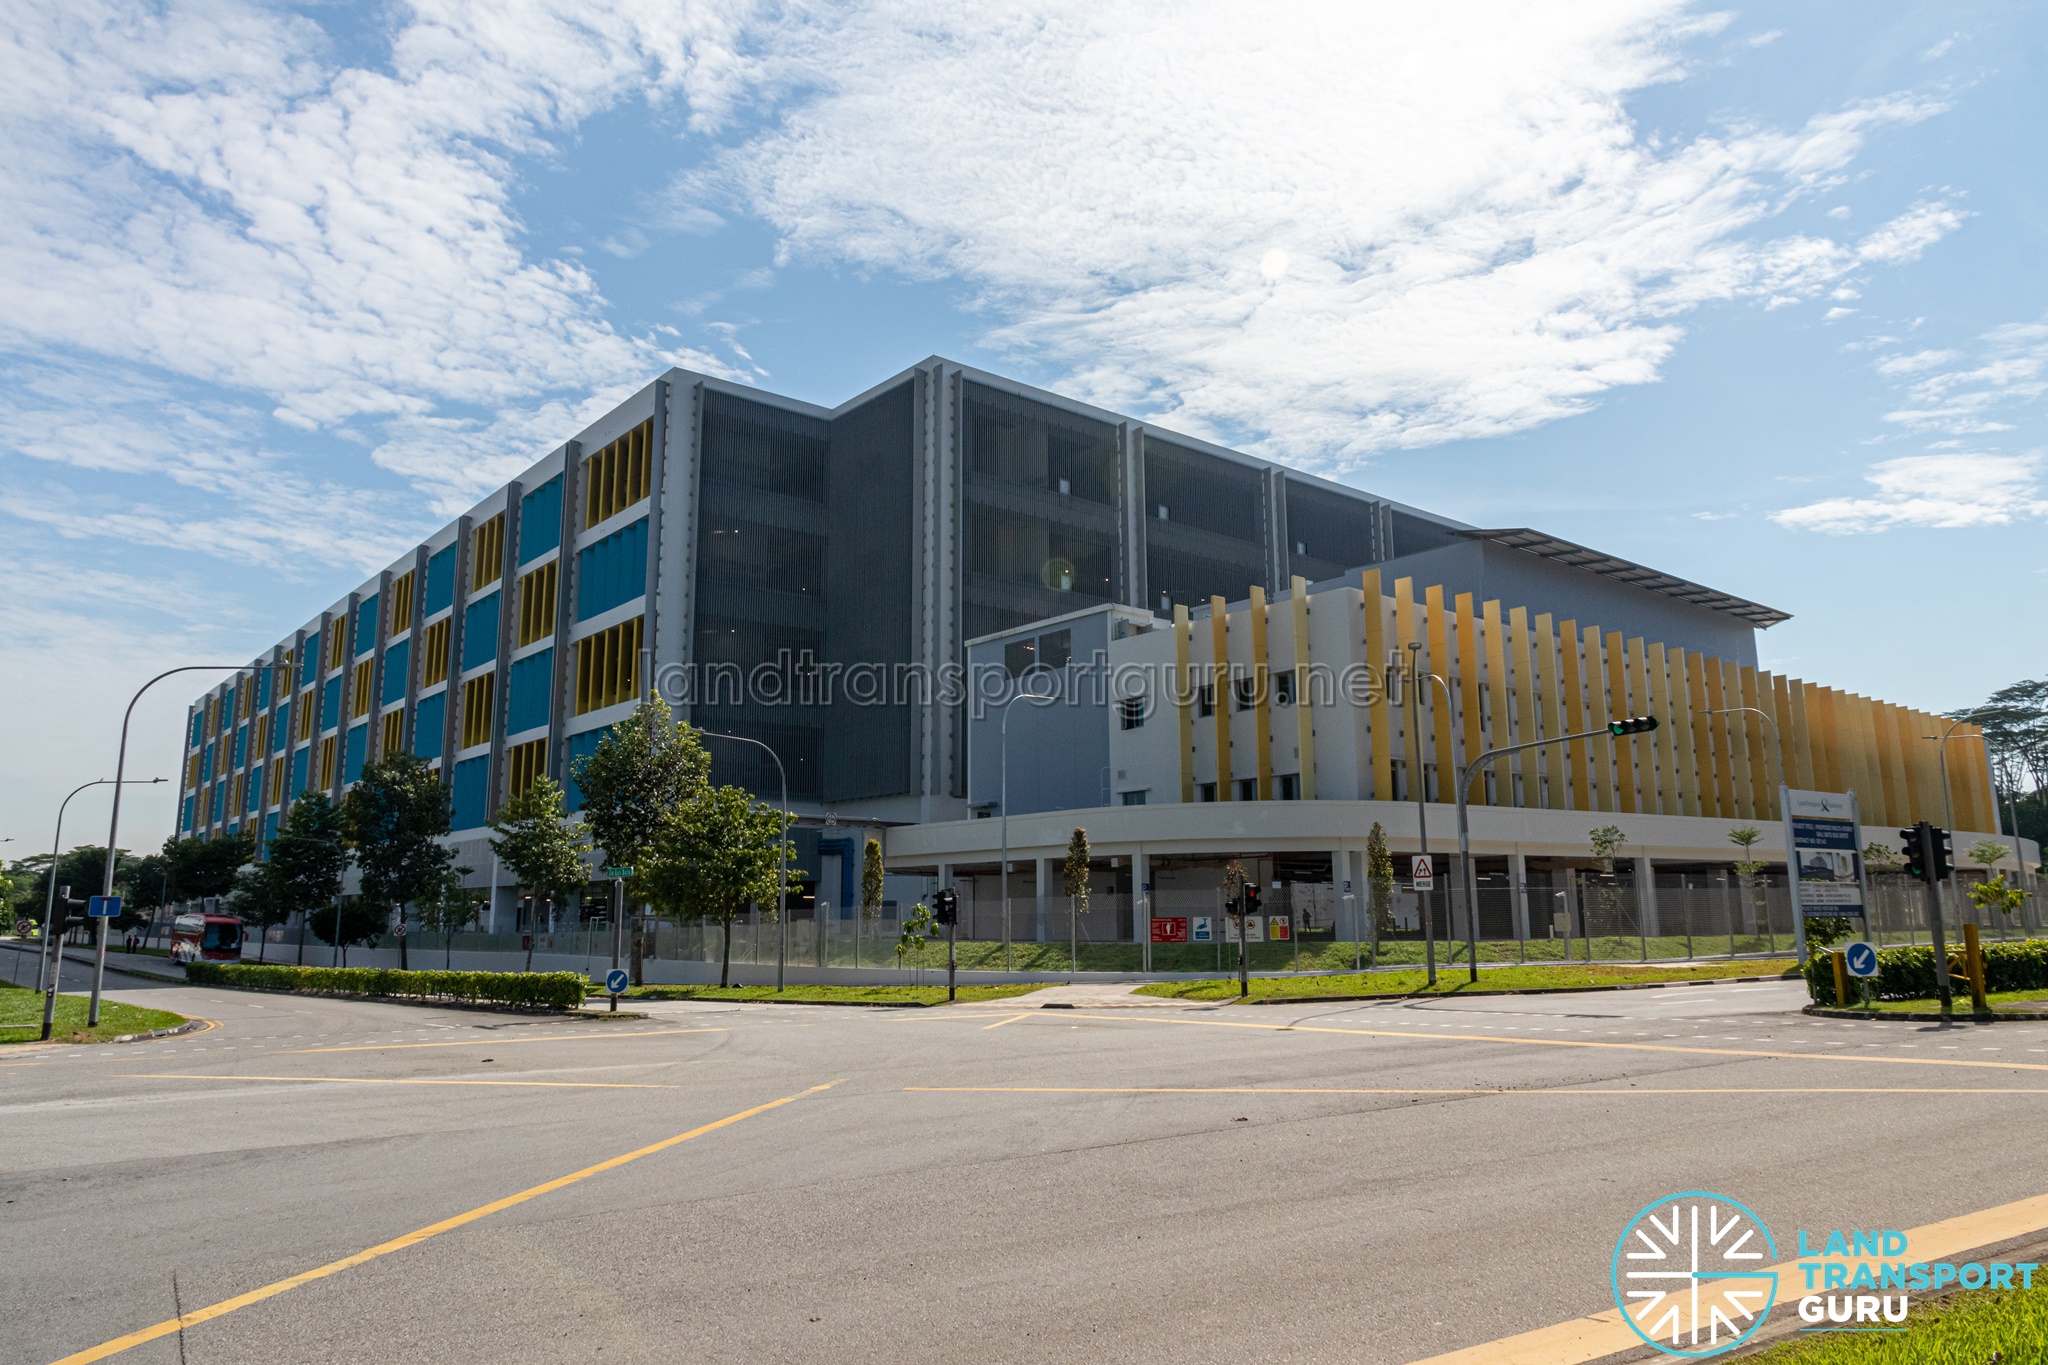

- Sengkang–Hougang: SBS Transit’s negotiated contract had previously been extended from 2021 to 2024, as reported by The Straits Times. Operations moved to Sengkang West Bus Depot in January 2025. The newspaper later reported a further extension of undisclosed duration, without explaining its reason.
- Choa Chu Kang–Bukit Panjang: SMRT Buses’ negotiated contract, originally due to expire in 2023, was extended to August 2026. Responding to media enquiries, LTA cited infrastructure readiness, operational stability and market conditions. Operations moved from Kranji Depot to Gali Batu Bus Depot in October 2025, within that extension period. SMRT Buses has continued operating beyond August 2026, but no further extension announcement has been made. The duration and reasons for the subsequent arrangement remain publicly unclear.
Although MOT has outlined several reasons for extending contracts, it remains unclear which considerations led LTA to retain negotiated arrangements for these two packages after their depot relocations.
MOT’s response also demonstrates that extension periods and reasons can be disclosed even when fees remain commercially sensitive. Publishing these details when extensions are agreed would help the industry and the public track BCM contract changes, without having to wait for parliamentary questions or media enquiries.
2. Tampines Bus Package — Tendering disclosures
Ms Eileen Chong Pei Shan also asked how bids were evaluated for the Tampines Bus Package. The Go-Ahead Group Limited’s winning alternative bid was approximately $646 million over five years, compared with SBS Transit’s lowest base bid of approximately $596 million for the same period. Her question covered the quality–price weighting, bidders’ rankings and the quality factors justifying the price difference. [Link]
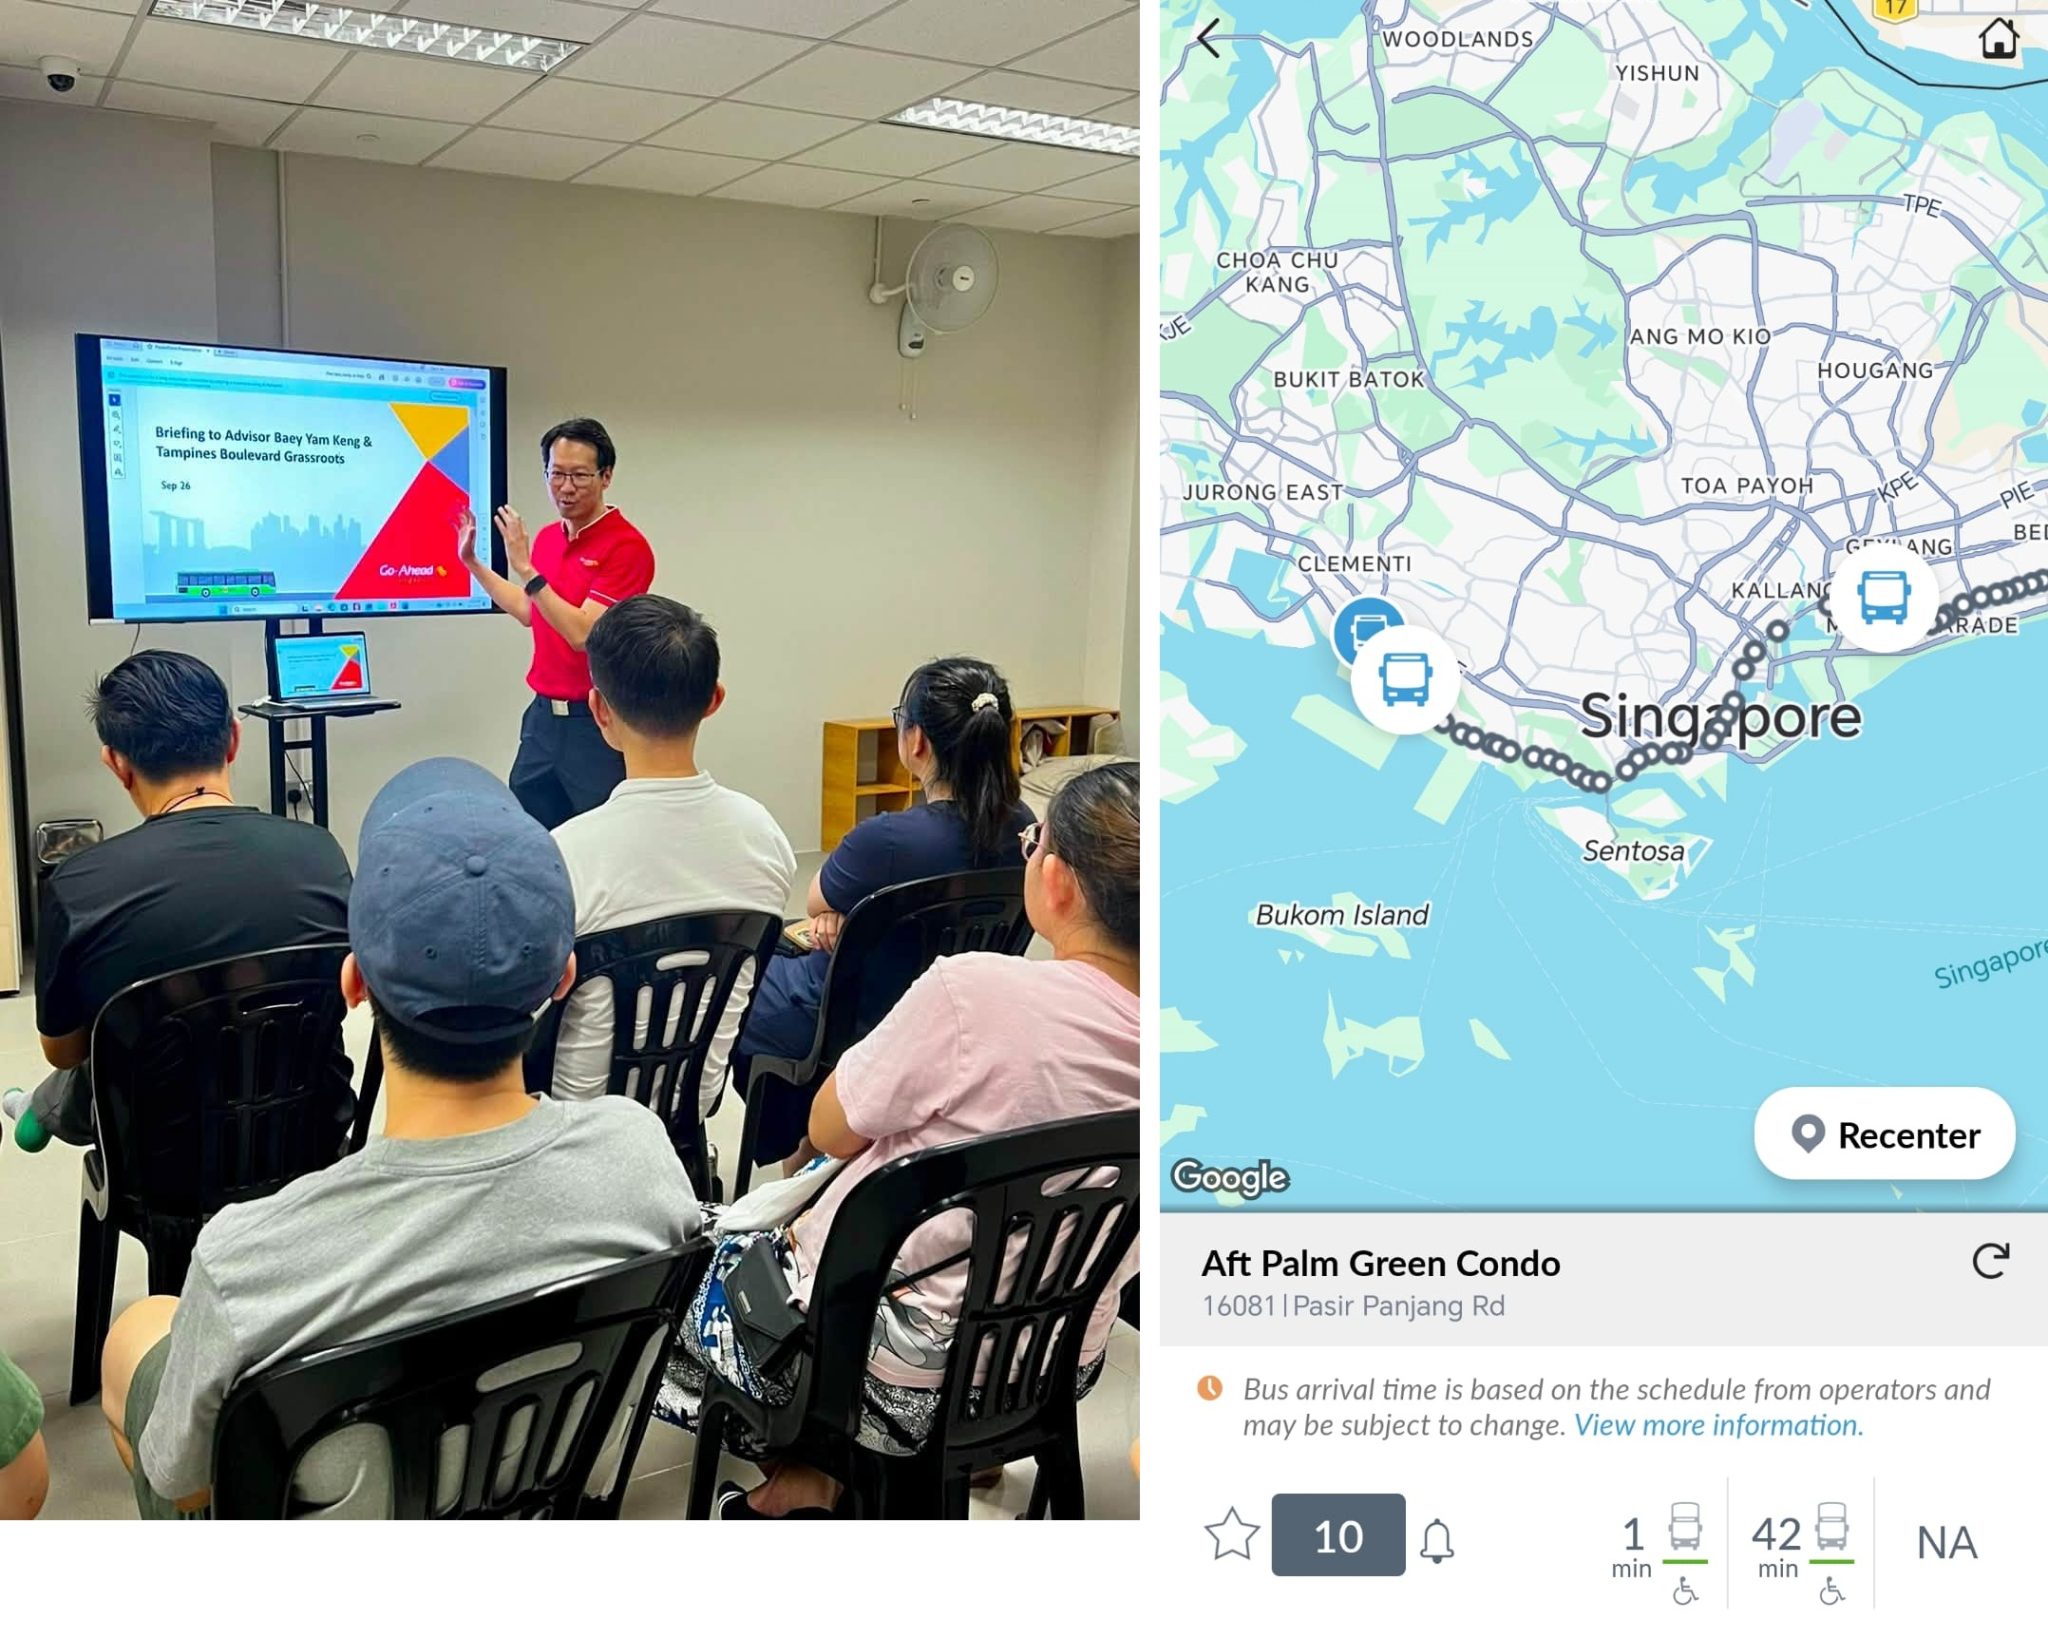
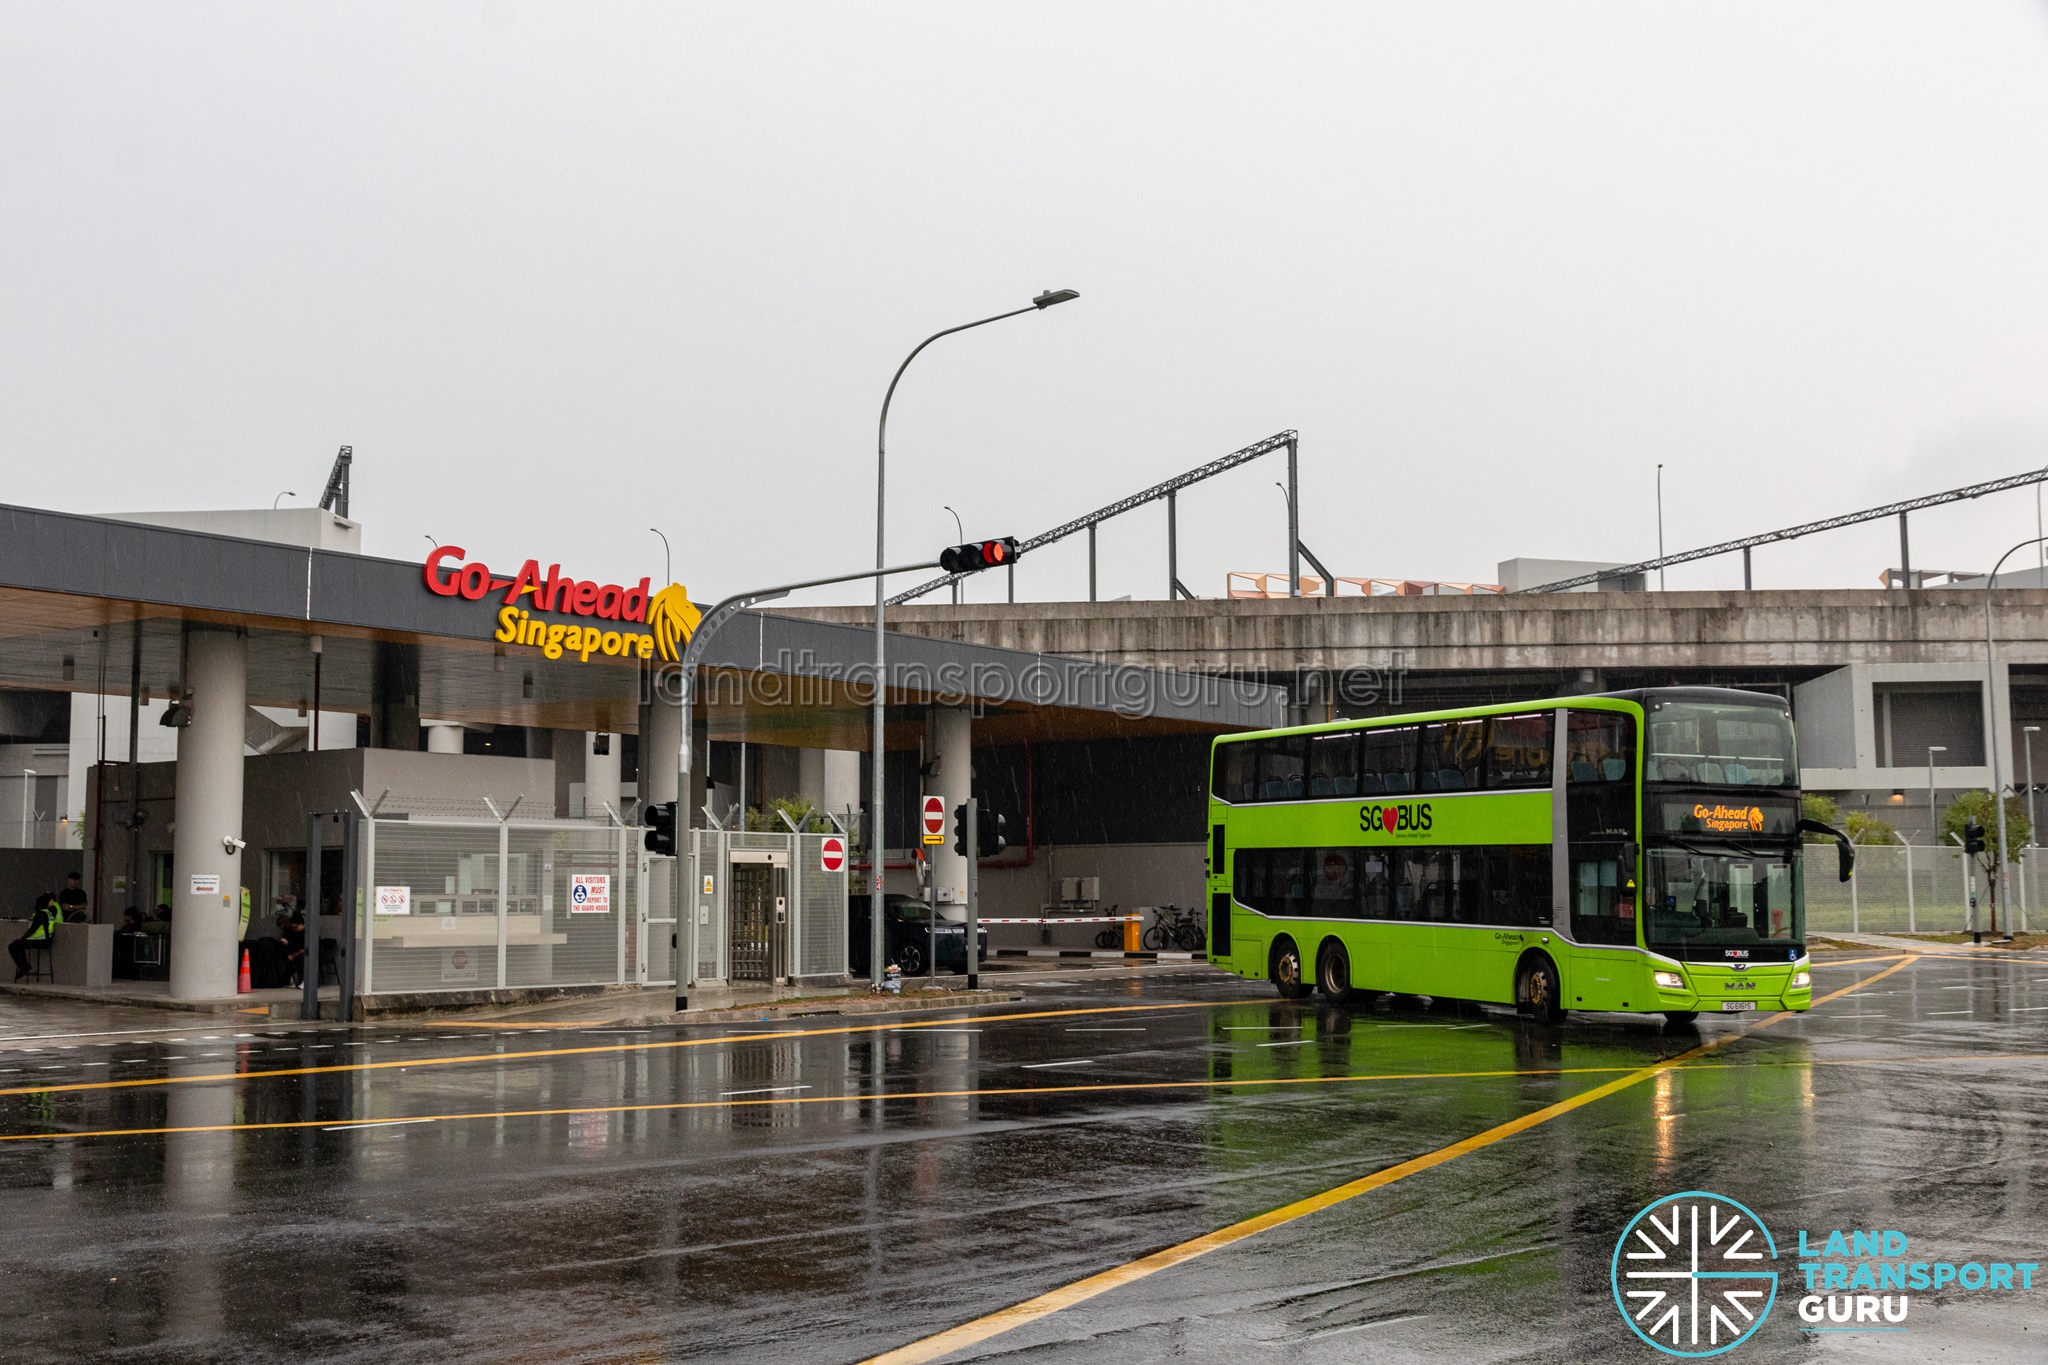
Tampines Bus Package tendering
LTA’s September 2025 award announcement had already explained the two-envelope evaluation process, the greater emphasis on electric bus operations and maintenance capabilities, and Go-Ahead’s highest overall score. It also outlined proposed initiatives drawing on the group’s electric-bus experience in London.
In the 6 October 2026 parliamentary reply, MOT disclosed that quality accounted for 60% of the evaluation and price for 40%.
| Bidder | New details revealed |
| The Go-Ahead Group Limited | Its winning bid achieved the highest quality score. It also achieved the highest overall score, as was previously disclosed during the tender award announcement. |
| SBS Transit Ltd | Its lowest-priced base bid achieved the second-highest overall score. |
| Tower Transit Singapore Pte. Ltd. / SMRT Buses Ltd |
Their bids scored lower on quality than SBS Transit’s bid, despite their higher prices. |
Post-transition reliability woes
MOT also reported that reliability had improved following Go-Ahead Singapore’s initial transition difficulties. By end-September 2026, most services in the package had matched or exceeded their reliability performance under the previous operator.
Some routes still required improvement, with LTA working with Go-Ahead Singapore to address these issues. The reply did not identify these routes or provide individual service results.
Commentary: Greater Transparency in Tender Evaluation
LTA already publishes bid prices and explains the strengths of winning proposals in its BCM award announcements. MOT’s disclosure of the quality–price weighting and comparative rankings is a welcome addition, giving the industry and the public more information on how competing proposals were assessed.
Including these details alongside bid prices in future award announcements would build on this practice, particularly where the winning proposal carries a substantial price premium.
Notably, Tampines was the first BCM tender award in which the winning proposal was priced above every evaluated bid from competing operators.
3. Fleet Deployment, Passenger Loading and Service Enhancements
Associate Professor Jamus Lim and Mr Gerald Giam asked about peak-period bus deployment, how passenger loading is measured, and how LTA accounts for commuters unable to board crowded buses. MOT’s replies on 6 and 7 October 2026 provided system-wide deployment figures and further details on capacity assessments. [Link][Link][Link]
Single-Deck and Double-Deck Bus Deployments
In its 6 October reply, MOT disclosed the following figures as at August 2026:
- Services using only single-deck buses during peak periods: 176 services
- Of these, services unable to accommodate double-deck buses because of height clearances or tight turns: 79 services
- Deployment of available double-deck buses: All were deployed during peak periods when available.
The reply did not explain the deployment considerations for the remaining 97 single-deck-only services individually. It also did not provide the number of peak-period enhancement requests declined because loading was below LTA’s threshold, as was requested in the Parliamentary Questions.
Measuring Passenger Loading
MOT clarified that passenger loading is assessed against the capacity of the buses actually deployed.
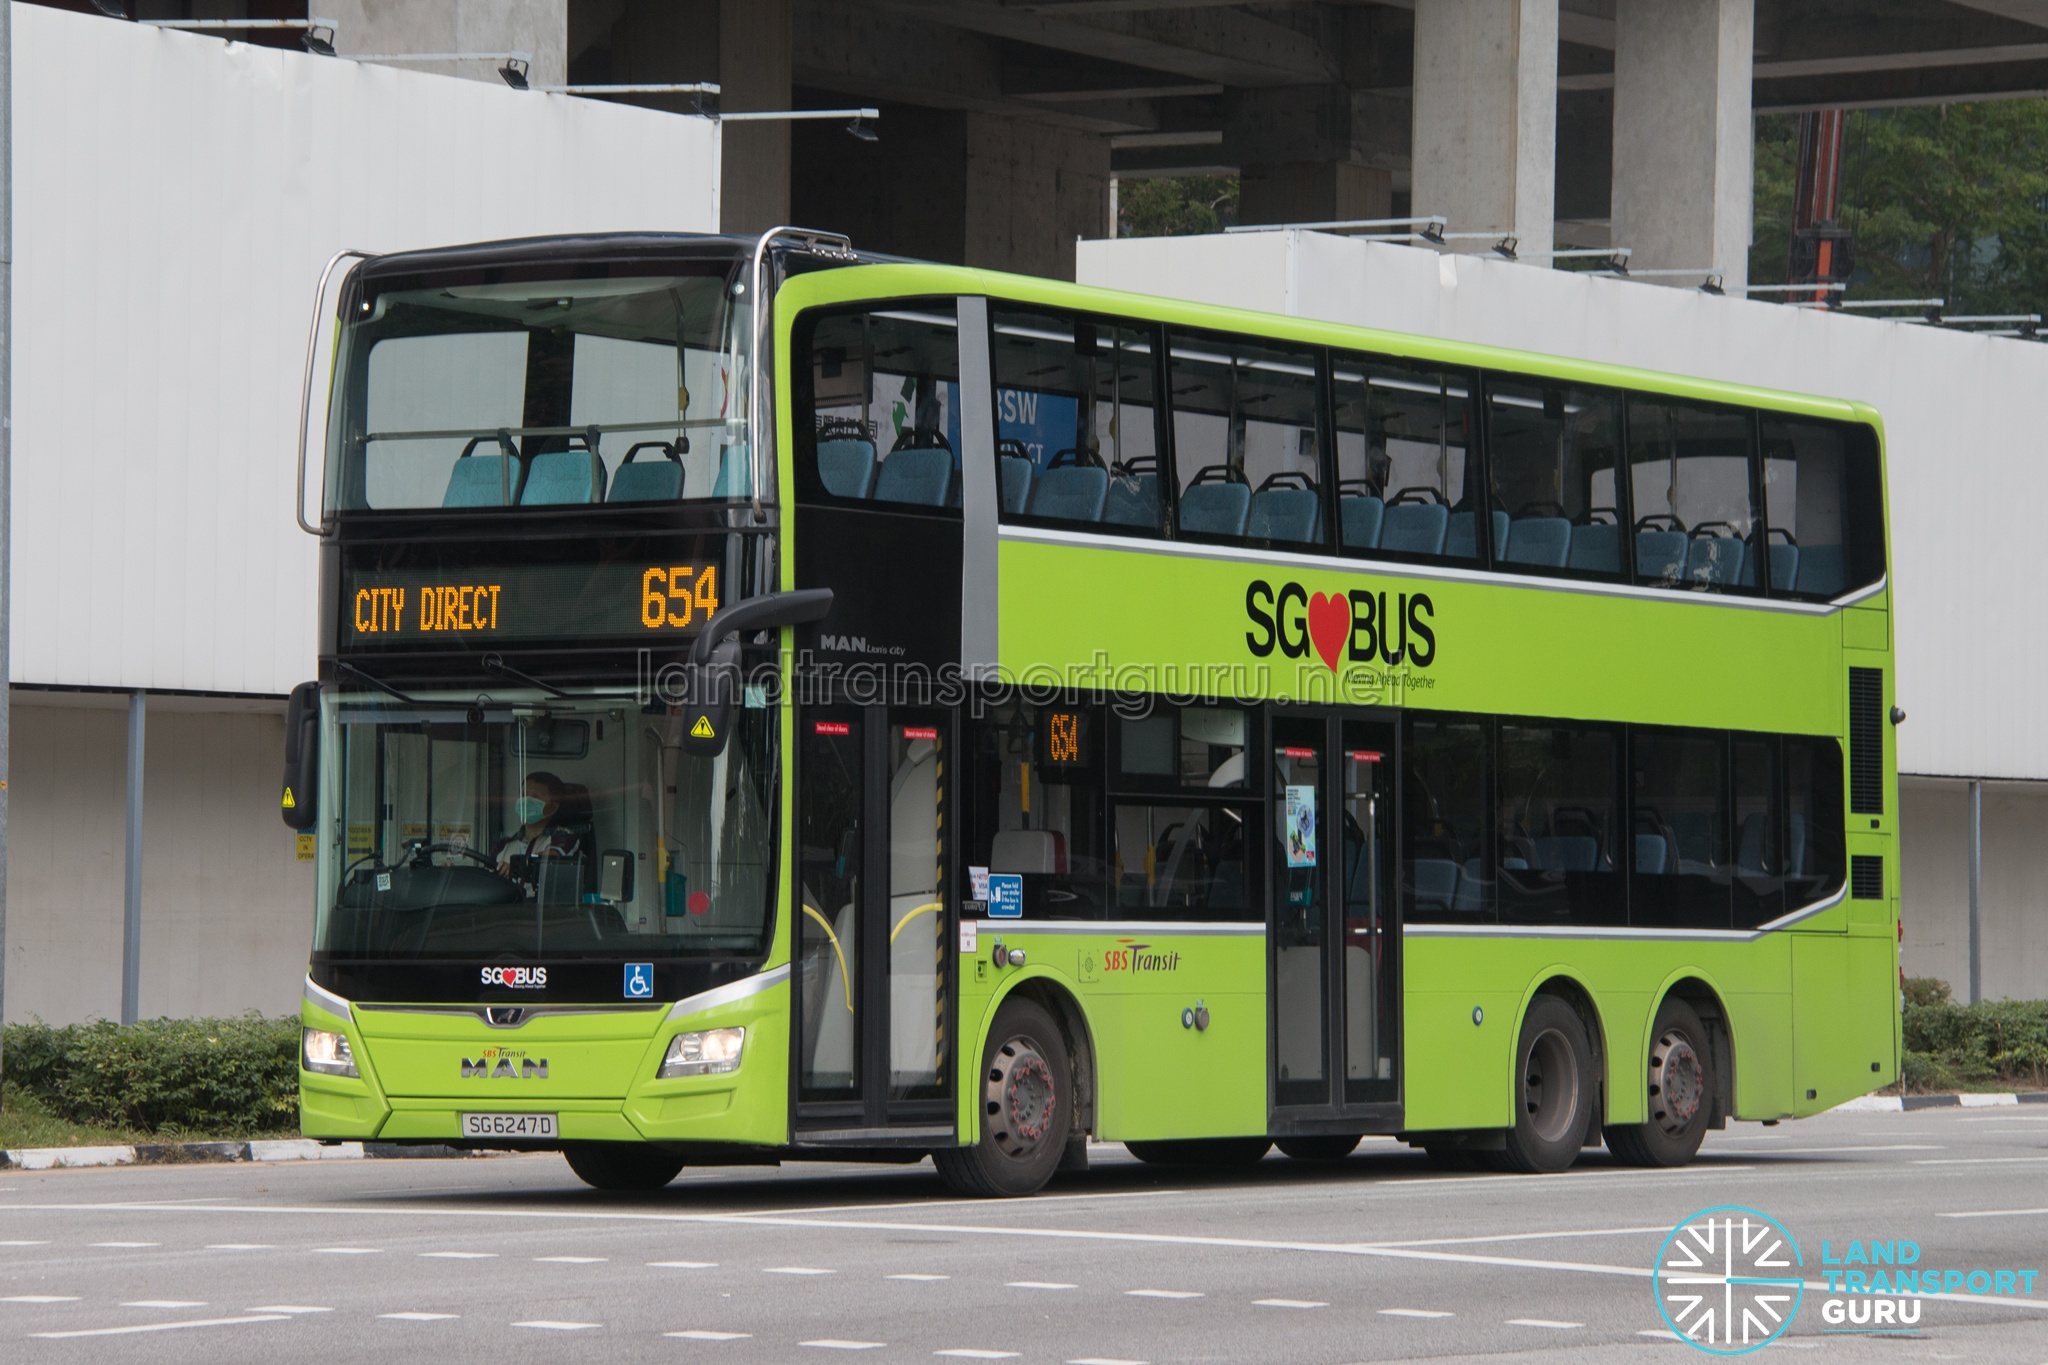
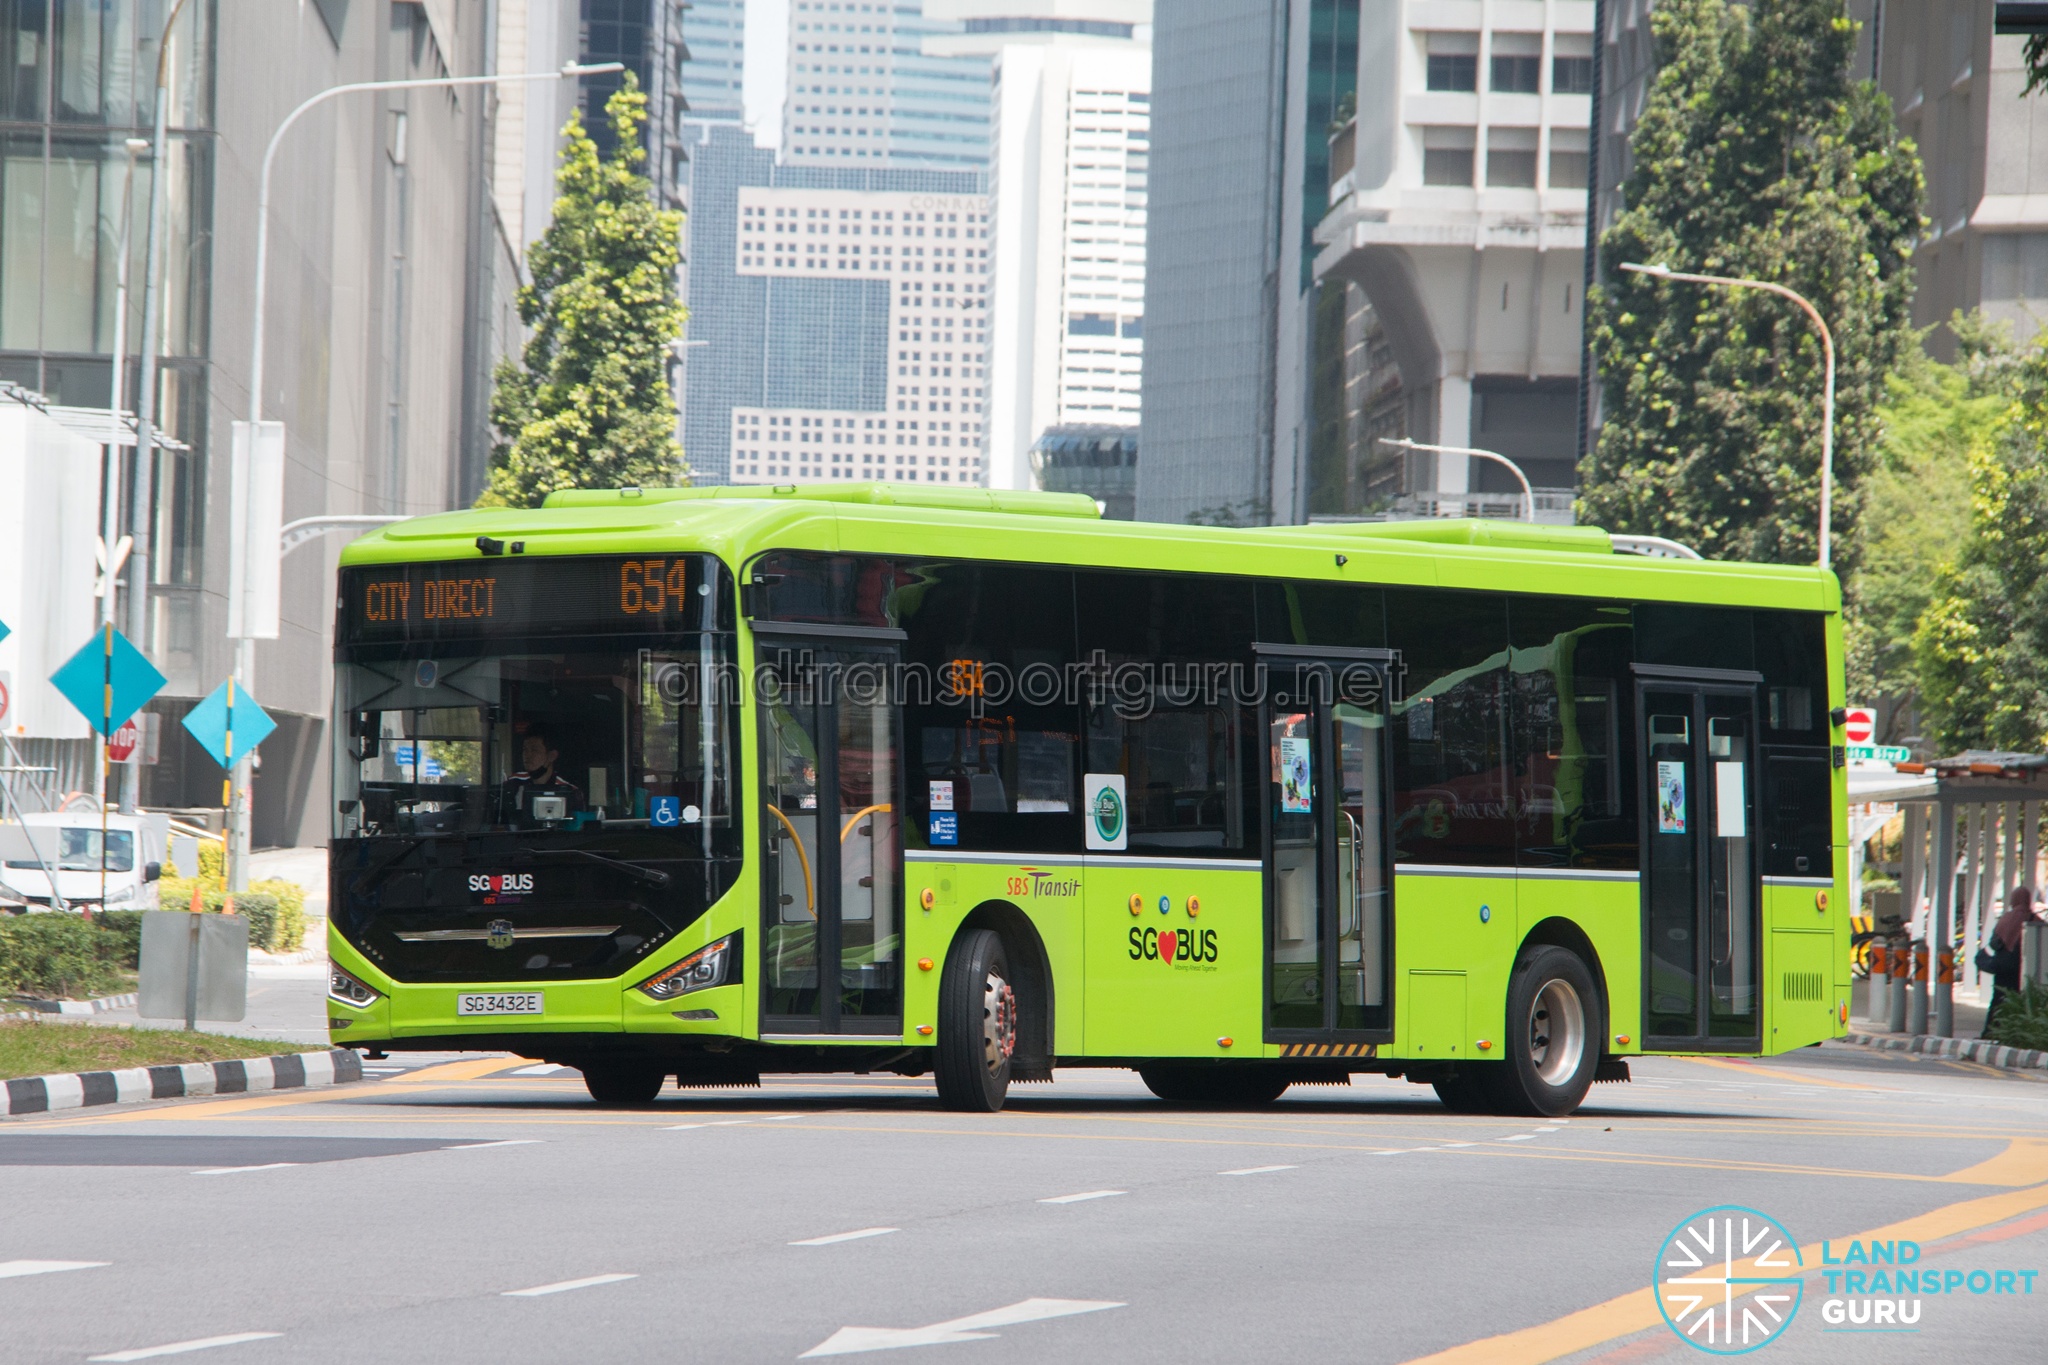
In a 7 October reply concerning City Direct Services 654, 671, 677 and 682, MOT explained that average loading compares average ridership from ticketing data across trips with the passenger capacity of the buses deployed for each trip. The reply provided the following capacity figures, which vary with bus model and design:
- Single-deck: 80–90 passengers
- Double-deck: 120–139 passengers
- Articulated: 131 passengers
These figures provide context for interpreting the average loading of several City Direct services, which were previously disclosed in September 2026. The averaging method described in this reply applies specifically to City Direct services.
| Service | Peak Period | 2023 | 2024 | 2025 | 20261 |
| 654 |
AM | 52% | 54% | 52% | 56% |
| PM | 34% | 35% | 36% | 31% | |
| 671 |
AM | 61% | 58% | 55% | 54% |
| PM | 36% | 34% | 32% | 36% | |
| 6772 |
AM | 39% | 56% | ||
| PM | 15% | 17% | |||
| 6823 |
AM | 13% | 32% | ||
| PM | 9% | 23% |
- [1] Refers to data from Jan to Aug 2026.
- [2] CDS 677 was implemented on 2 Jan 2025.
- [3] CDS 682 was implemented on 15 Dec 2025. 2025 loading is based on data from 15 Dec to 31 Dec 2025.
Passengers Unable to Board
In a separate reply on 7 October, MOT explained that routes with high loading during the heaviest 30-minute window are monitored for situations where passengers cannot board.
LTA works with operators to conduct on-site surveys and review commuter feedback at bus stops along these routes. Service adjustments are made when passengers are frequently unable to board.
The 6 October reply also explained that enhancement requests are assessed against several considerations, namely:
- Passenger loading
- Resource availability
- Capacity on adjacent bus services
- Alternative travel options
Commentary: Understanding Loading Figures
The replies clarify that loading is measured against the capacity of the buses actually deployed. However, loading percentages do not fully describe the crowding experienced by passengers. Licensed capacity is calculated using prescribed assumptions about seating, standing space and vehicle weight limits, including a floor-space allowance of 0.15 square metres per standing passenger. It is not a measure of comfortable occupancy.
Bus layout also matters. Double-deck buses generally accommodate a greater proportion of passengers in seats. The same loading percentage on a single-deck and double-deck bus can therefore mean different chances of getting a seat and different levels of crowding in standing areas. An overall figure also does not show whether passengers are concentrated near the doors or on the lower deck.
Average loading across departures can mask particularly crowded trips. For a City Direct service using double-deck buses only on selected departures, spare capacity on those trips may lower the reported average even while a single-deck departure is crowded to the doors. Passengers cannot necessarily use capacity available on a bus departing at another time.
Ticketing data records passengers on the bus they eventually board, but does not directly reveal whether they were unable to board an earlier bus or how much longer they waited. Ground observations and commuter feedback help identify these boarding difficulties. The explanation of the 30-minute monitoring window is useful, although the replies do not specify a numerical loading threshold for triggering additional checks.
See also:
- Fleet Restrictions | Land Transport Guru
- Deployment Timeline of High Capacity Buses | Land Transport Guru
4. Operator Performance, Incentives and Penalties
Mr Chua Kheng Wee Louis asked for annual operator-level figures on BCM performance indicators, including excess wait time, on-time adherence and scheduled mileage, together with incentive payments and penalties. [Link]
MOT’s 6 October 2026 reply provided aggregate historical performance figures, a range for reliability incentives and penalties, and an update on the review of more detailed reliability reporting.
New Reliability Statistics
MOT published the following percentages of bus services meeting performance baselines:
| 2017 | 2018 | 2019 | 2020 | 2021 | 2022 | 2023 | 2024 | 2025 |
| 94.0% | 99.2% | 98.4% | 100.0% | 98.1% | 97.4% | 97.0% | 84.9% | 90.5% |
The proportion fell from 97.0% in 2023 to 84.9% in 2024, before recovering to 90.5% in 2025. The reply did not explain these changes or provide separate results by operator or performance indicator.
Corridor-Level Performance: Jurong East and Jurong West
In a separate reply on 7 October 2026, MOT addressed Dr Hamid Razak’s question about peak-hour bus performance along Jurong East Avenue 1 and Jurong West Avenue 1. Of the nine services using these roads, six met their respective reliability baselines, while three fell marginally short. LTA was working with the operators to improve their performance. The reply did not identify the three services, quantify their shortfalls or specify the assessment period.
Reliability Incentives and Penalties
MOT stated that overall reliability incentives and penalties received by operators ranged from −0.1% to 5.9% of contracted service fees, and correlated with individual operators’ performance. Expressing the amounts as a proportion of service fees was intended to account for scheduled mileage.
The reply did not provide the requested annual breakdown by operator, the corresponding dollar amounts, or identify which operators and years accounted for the ends of the range.
Proposed Bus Reliability Statistics
The review follows Louis Chua’s call for more data on bus operators’ performance over time, raised during his adjournment motion, “Reaching 75%: Reforming Singapore’s Public Transport System”, on 4 August 2026. Responding then, Senior Minister of State for Transport Sun Xueling said the suggestion could be considered.
In its October reply, MOT said LTA was considering releasing disaggregated reliability data to better reflect commuters’ experiences and support improvements to service delivery. The review was expected to conclude in early 2027. This is a review of potential disclosure, rather than a commitment to publish a particular dataset or reporting format.
Commentary: Further Disclosure of Bus Statistics Needed
As discussed in our previous article, Singapore’s Bus Contracting Model, Ten Years On, publicly available information remains insufficient for regular comparisons of bus operator performance. These parliamentary replies add useful figures, but leave important gaps in identifying where standards are not being met.
Both the Jurong East Ave 1 / Jurong West Ave 1 corridor and Tampines replies describe services requiring improvement without identifying them. In Tampines, MOT reported that most services had matched or exceeded their reliability under the previous operator, but did not name those still lagging behind. The Jurong reply likewise left the three underperforming services and their operators unidentified. Commuters should know which services are falling short and which operators are responsible for improving them. Publishing service-level results would allow the public to track whether corrective measures lead to improvements.
Similarly, the range of reliability incentives and penalties does not show what each operator received or incurred annually, despite the question requesting this breakdown. This limits scrutiny of how service performance translates into financial rewards and penalties.
LTA’s review of disaggregated reliability reporting is welcome. Regular publication of service-level results and operator-level incentive and penalty figures would provide a clearer account of service delivery and the use of public funds, without relying on individual parliamentary questions to bring these details into public view.
5. Late-Night Bus Services
Mr Cai Yinzhou asked whether the government has assessed late-night transport needs following the formalisation of liquor trading hours until 4 am at Boat Quay and Clarke Quay, and whether it would consider extended MRT hours or night bus services. [Link]
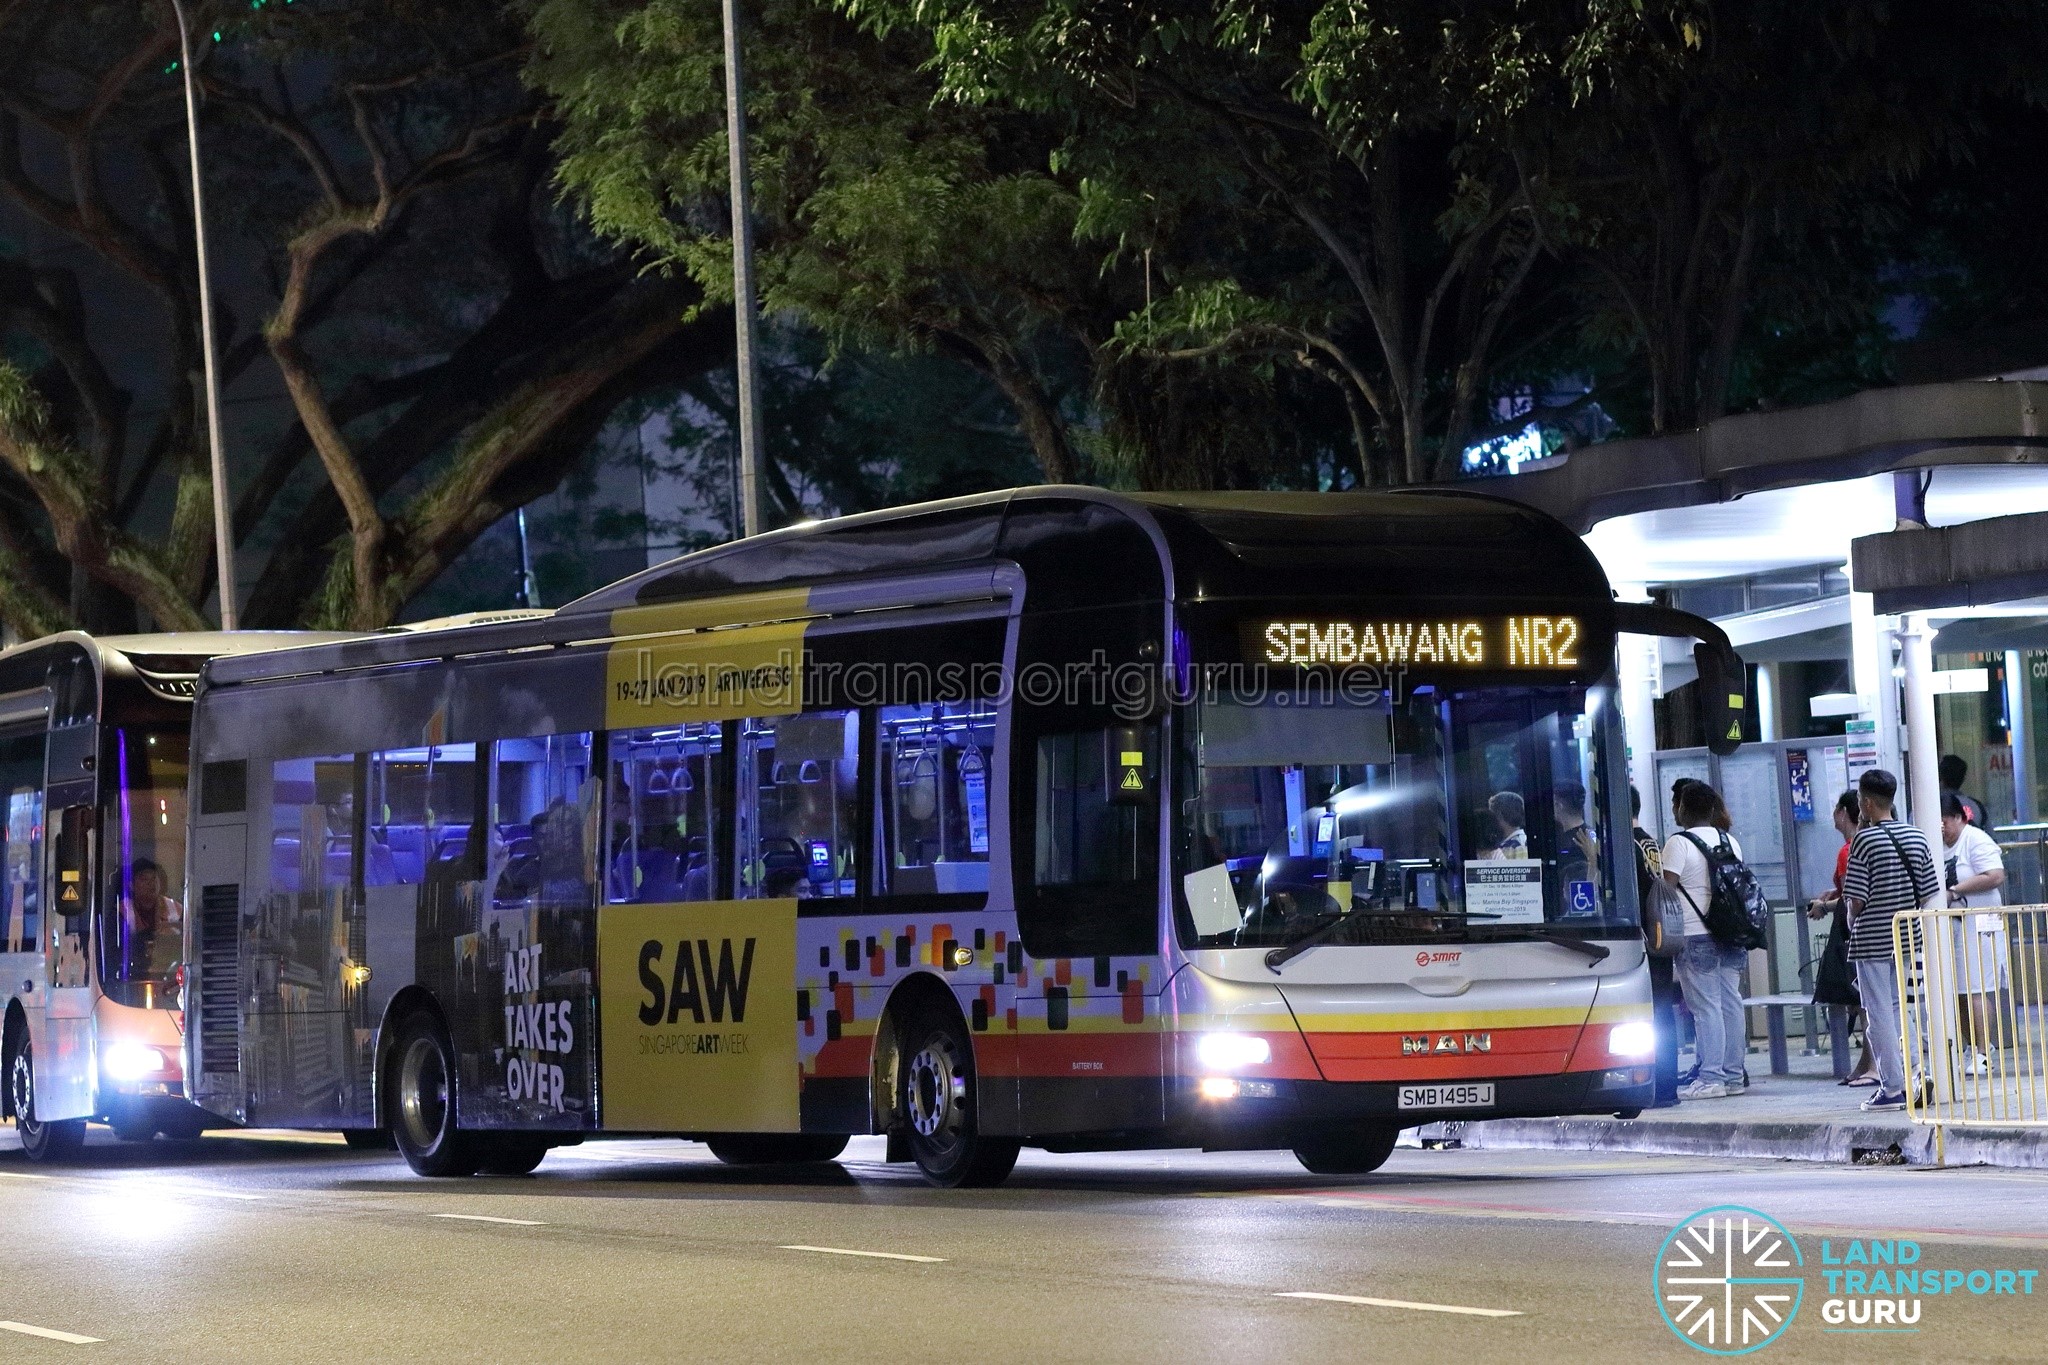
Unlike the preceding replies, MOT’s 6 October 2026 response largely reiterated existing policy. It remains relevant to service provision under the BCM, following the cessation of the former NightRider and Nite Owl services.
Operating hours and Demand levels
MOT stated that public buses and trains operate for approximately 18 hours daily, leaving a limited maintenance window. Extending operating hours would reduce that time, place further demands on resources and potentially affect daytime reliability.
It also cited subsidies for public bus services and low pre-pandemic night-bus patronage, at approximately 13% of capacity at its busiest. LTA remained open to proposals from private bus operators, alongside existing taxi and ride-hail options.
These explanations were substantially covered in MOT’s February 2023 reply, which described the 13% figure as average loading during the busiest hour. The October reply provided no updated demand figures or announcement of new services.
Commentary: Assessing Present-Day Night Bus Demand
The cited 13% loading figure indicates low average utilisation, but does not show how demand differed between routes and departures. As discussed in the earlier section on passenger loading, averages can mask these differences. More importantly, the figure reflects pre-pandemic travel patterns, which may no longer represent nightlife activity or the needs of patrons and workers today. The reply provided no updated demand assessment for Boat Quay and Clarke Quay.
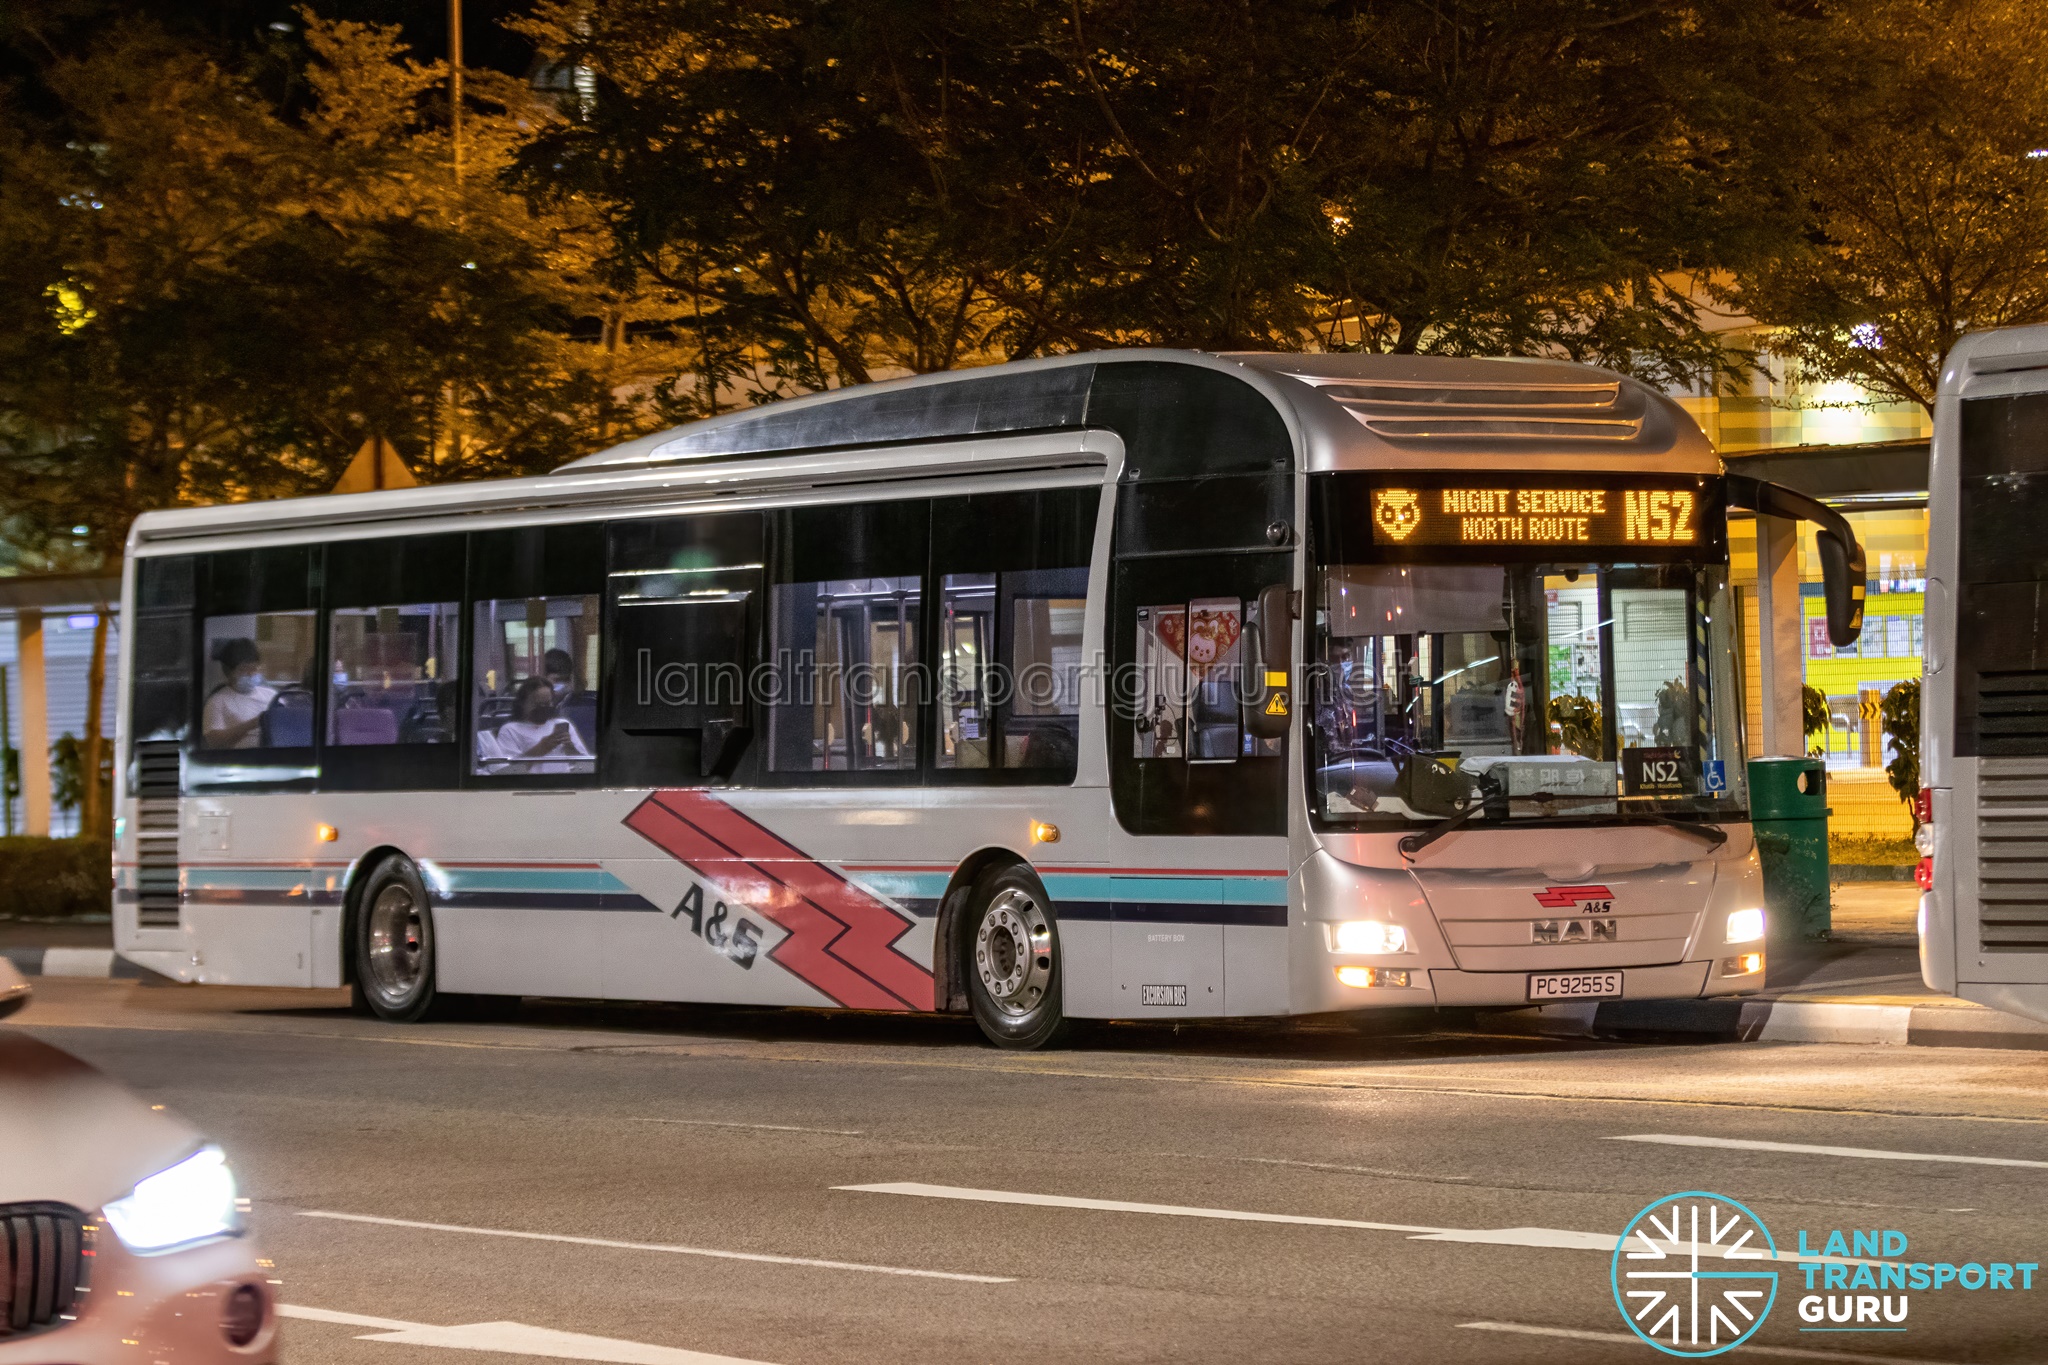
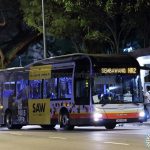
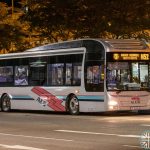
Private operators have previously attempted to fill the gap. A&S Transit’s NS-1 and NS-2 began operating in January 2023, but were suspended around five months later. Interest from private operators may indicate potential demand, but sustaining a service also depends on its routes, fares and operating frequency.
An updated assessment, with demand broken down by location and time, would provide a stronger basis for considering whether a revised night bus network could meet present-day needs.
References:
- Extension of Loyang Bus Package Contract Versus Retendering – Ministry of Transport [6 Oct 2026]
- Evaluation of Bids for Tampines Bus Package – Ministry of Transport [6 Oct 2026]
- Data on Deployment of Single-Deck Buses During Peak Periods and Declined Enhancement Requests, and Assessing Loading Against Actual Bus Capacity Deployed – Ministry of Transport [6 Oct 2026]
- Data on Loading Measurement and Capacity Denominators for City Direct Services 654, 671, 677 and 682 by Bus Type – Ministry of Transport [7 Oct 2026]
- Evaluating Public Bus Passenger Capacity, Boarding Demand and Peak-Hour Performance Metrics – Ministry of Transport [7 Oct 2026]
- Breakdown of Bus Operator Key Performance Indicators, Incentive Payments and Penalties Since Introduction of Bus Contracting Model – Ministry of Transport [6 Oct 2026]
- Bus Service Peak-Hour Performance Along Jurong East Avenue 1 and Jurong West Avenue 1 and Alternative Bus Priority Approaches Following Smart Bus Priority System Trial – Ministry of Transport [7 Oct 2026]
- Assessing Late-Night Transport Needs and Coordinating Transport Planning for Extended Entertainment Hours at Boat Quay and Clarke Quay – Ministry of Transport [6 Oct 2026]