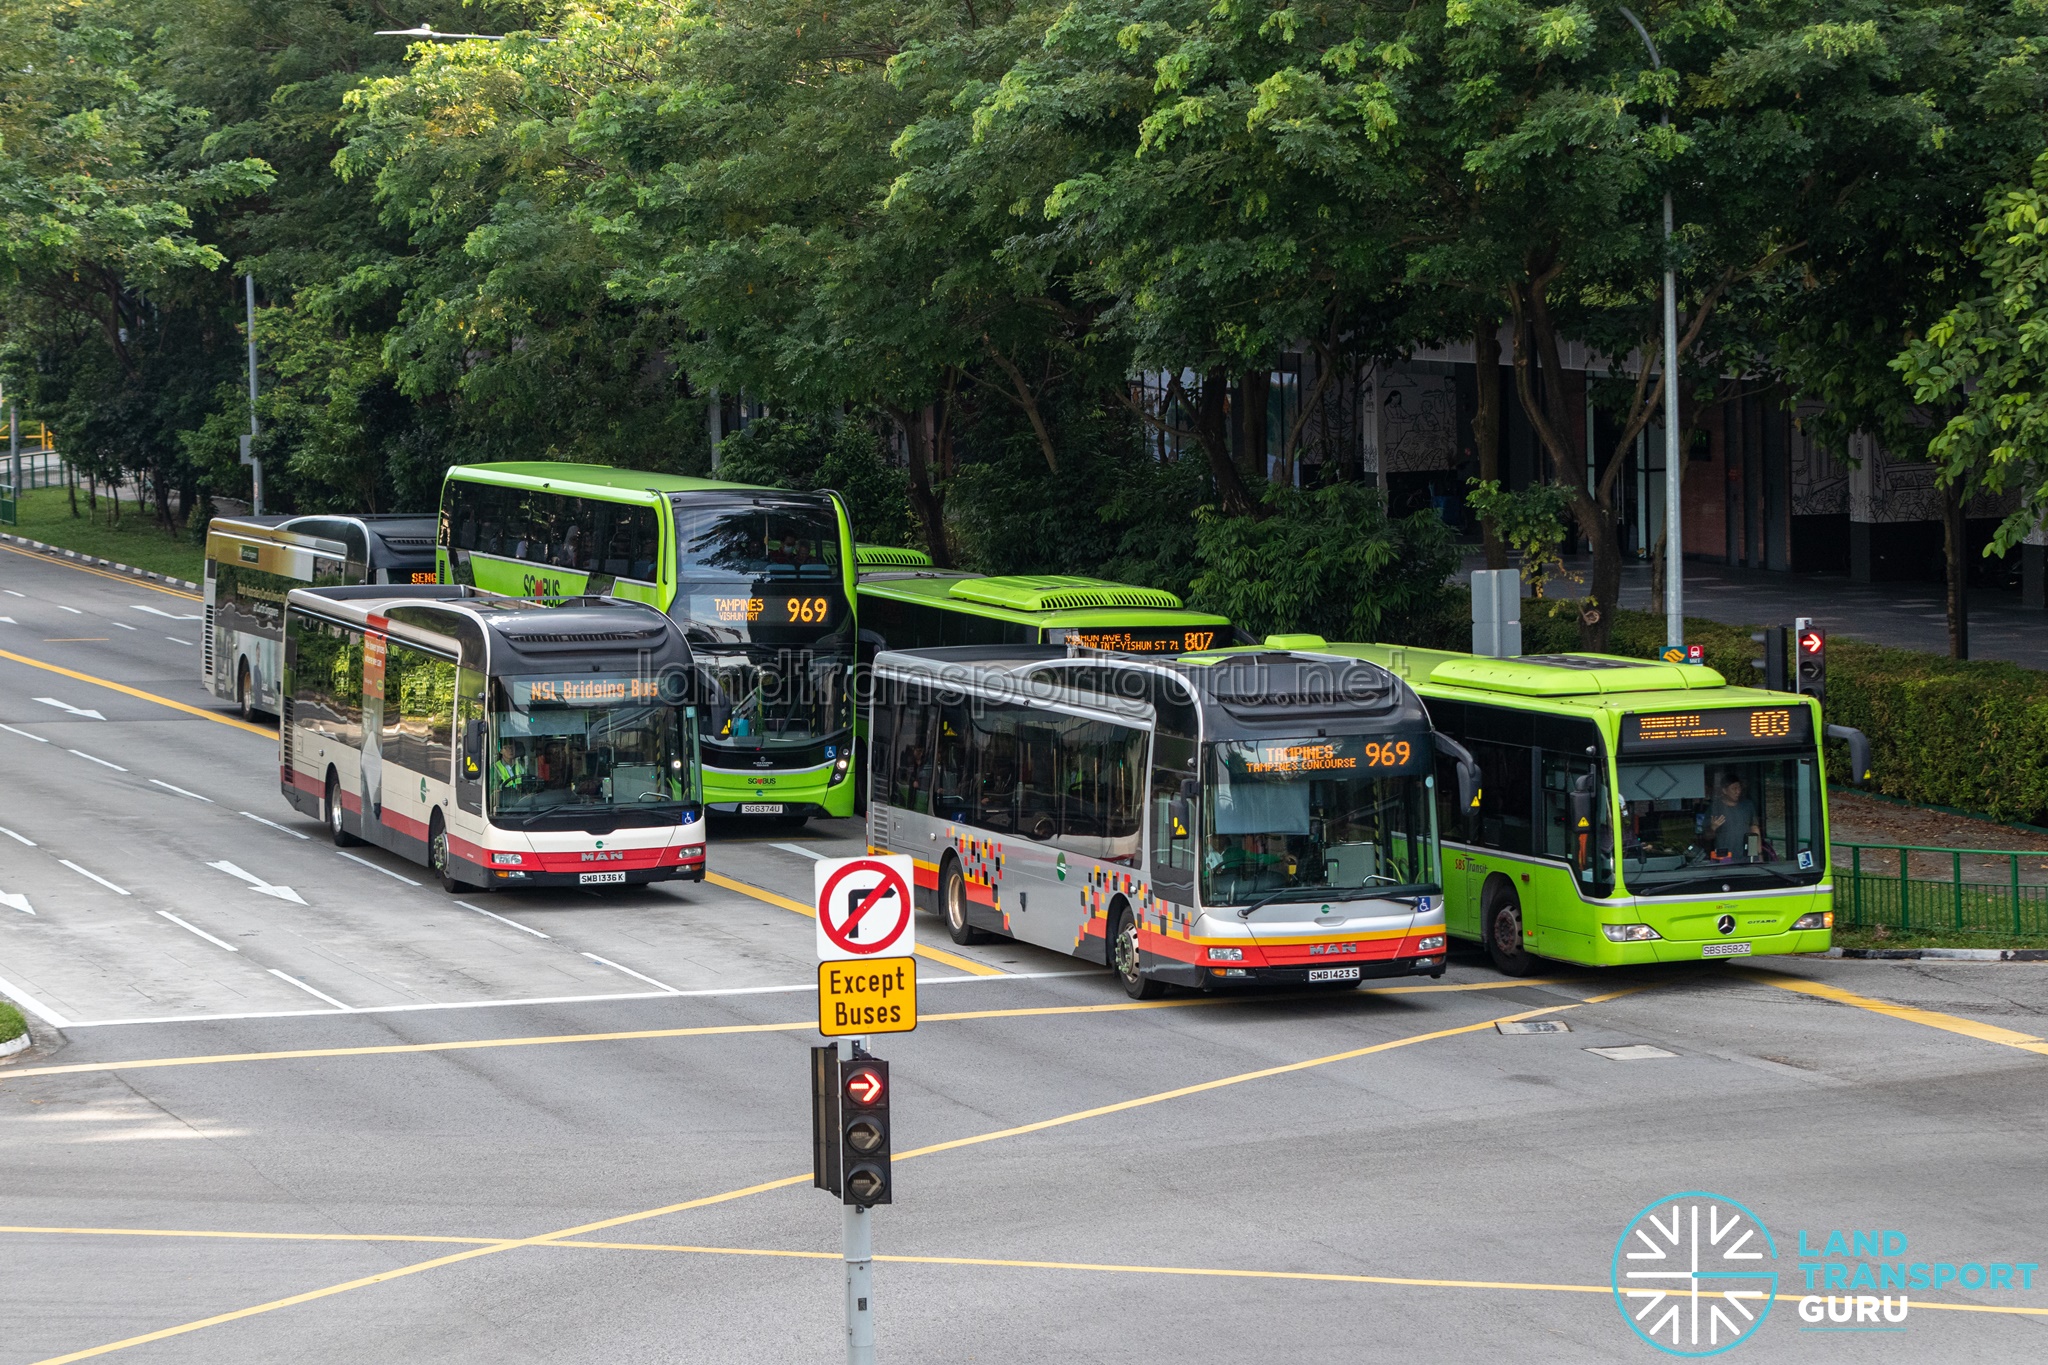
Singapore’s Bus Contracting Model (BCM) reaches an important milestone in 2026. Rolled out on 1 September 2016, it fundamentally changed the relationship between the Government, bus operators and commuters — and a decade later, the clearest conclusion is that BCM has worked, though not quite in the way originally envisaged.
Ten years on, the clearest way to state the finding is this: BCM solved the specific problem it was built to solve — shifting revenue and ridership risk onto Government so the network could be planned centrally — but the mechanism meant to keep that arrangement honest, competitive tendering, has stalled far more than its original framing suggested it would.
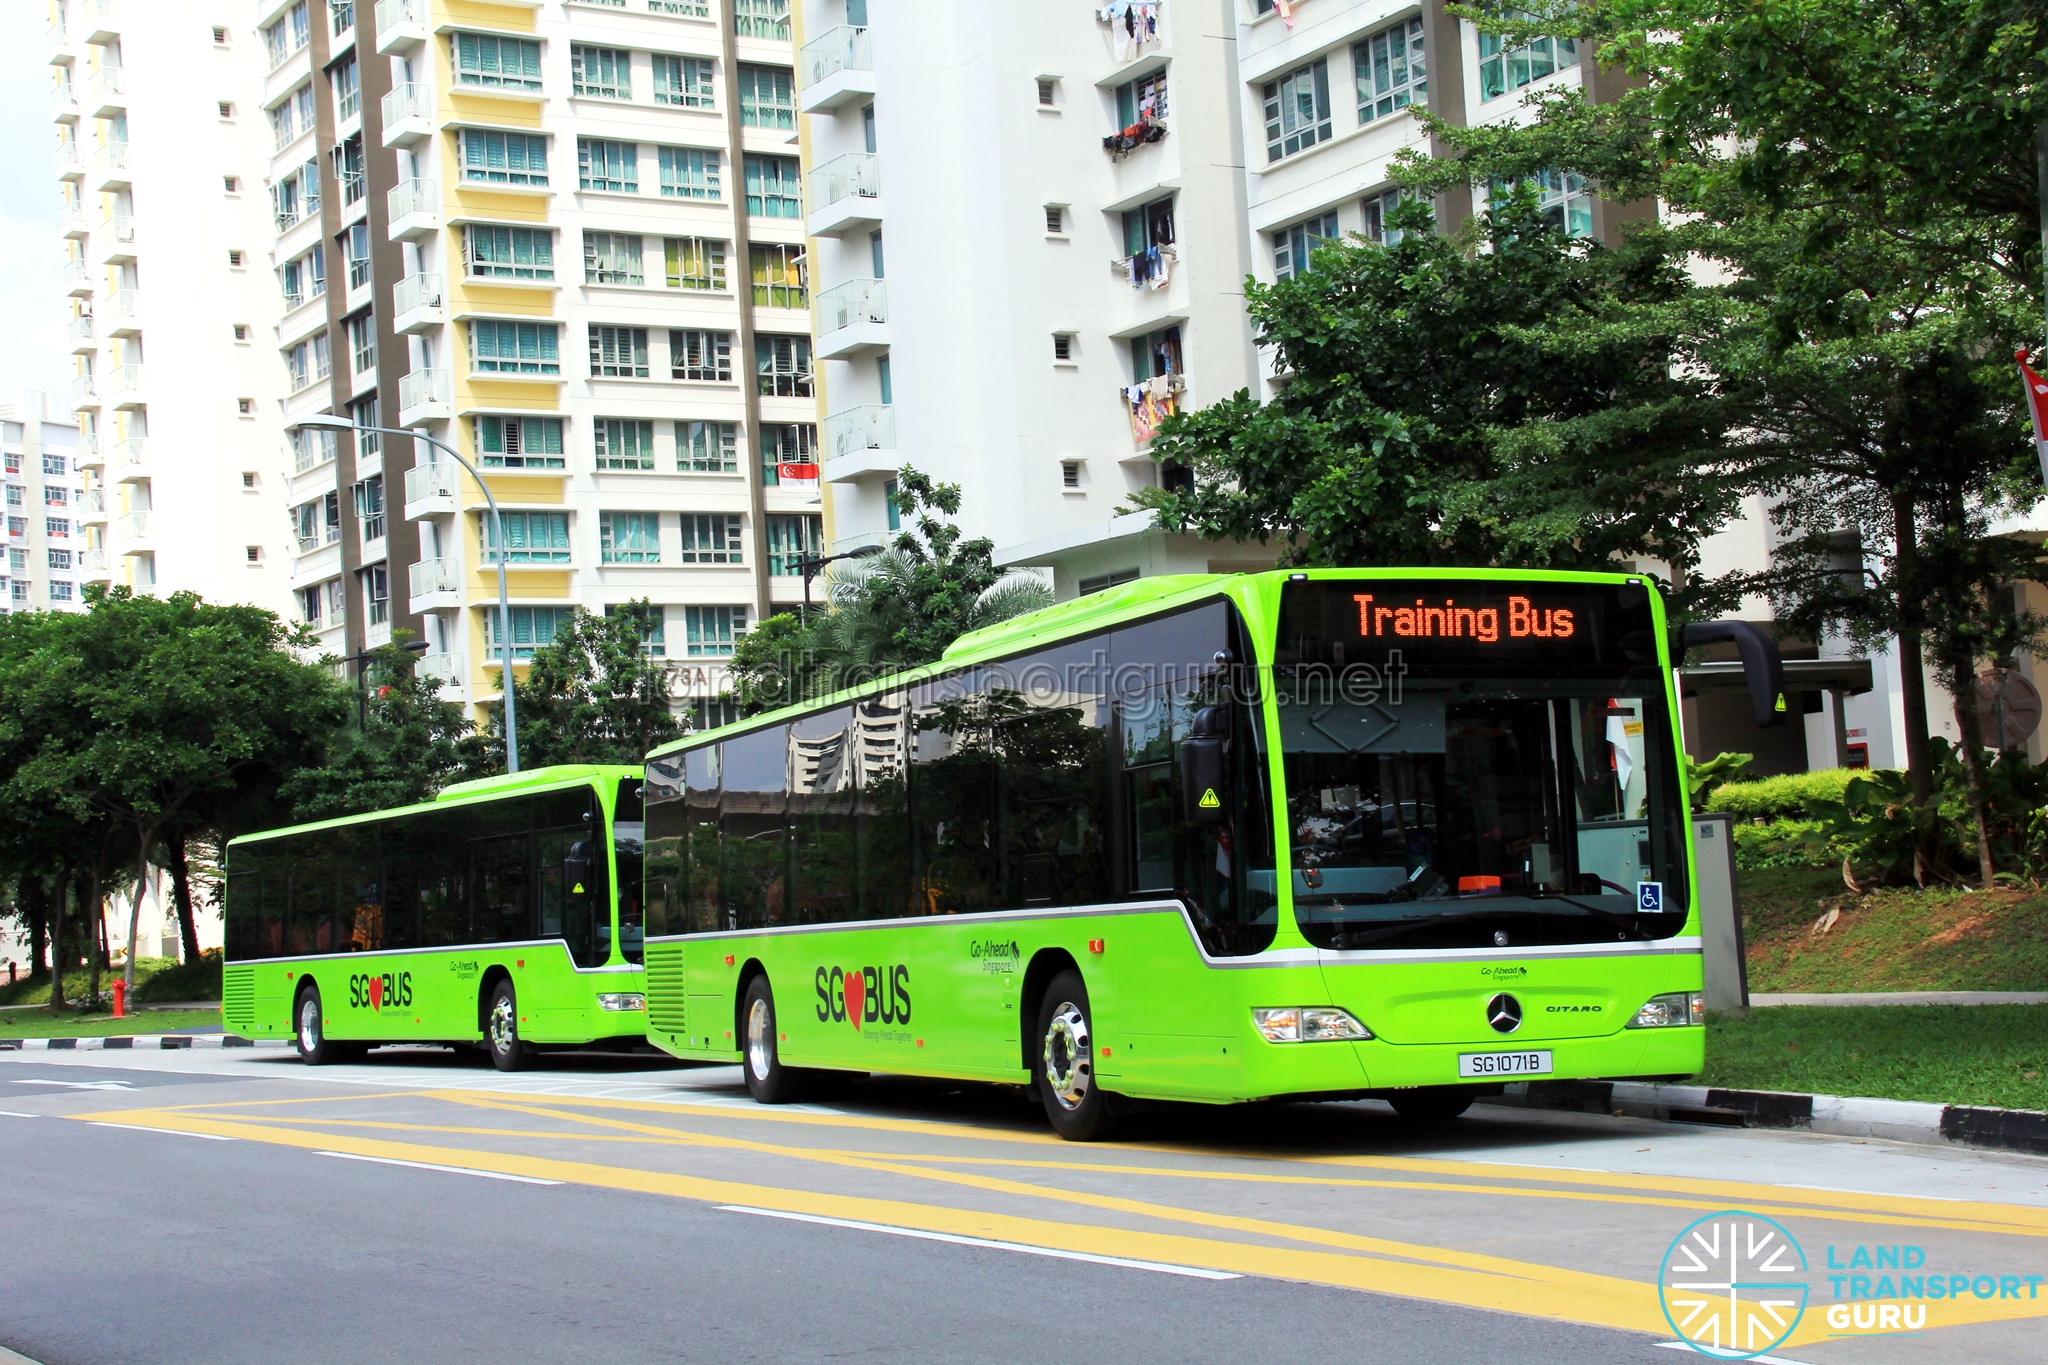
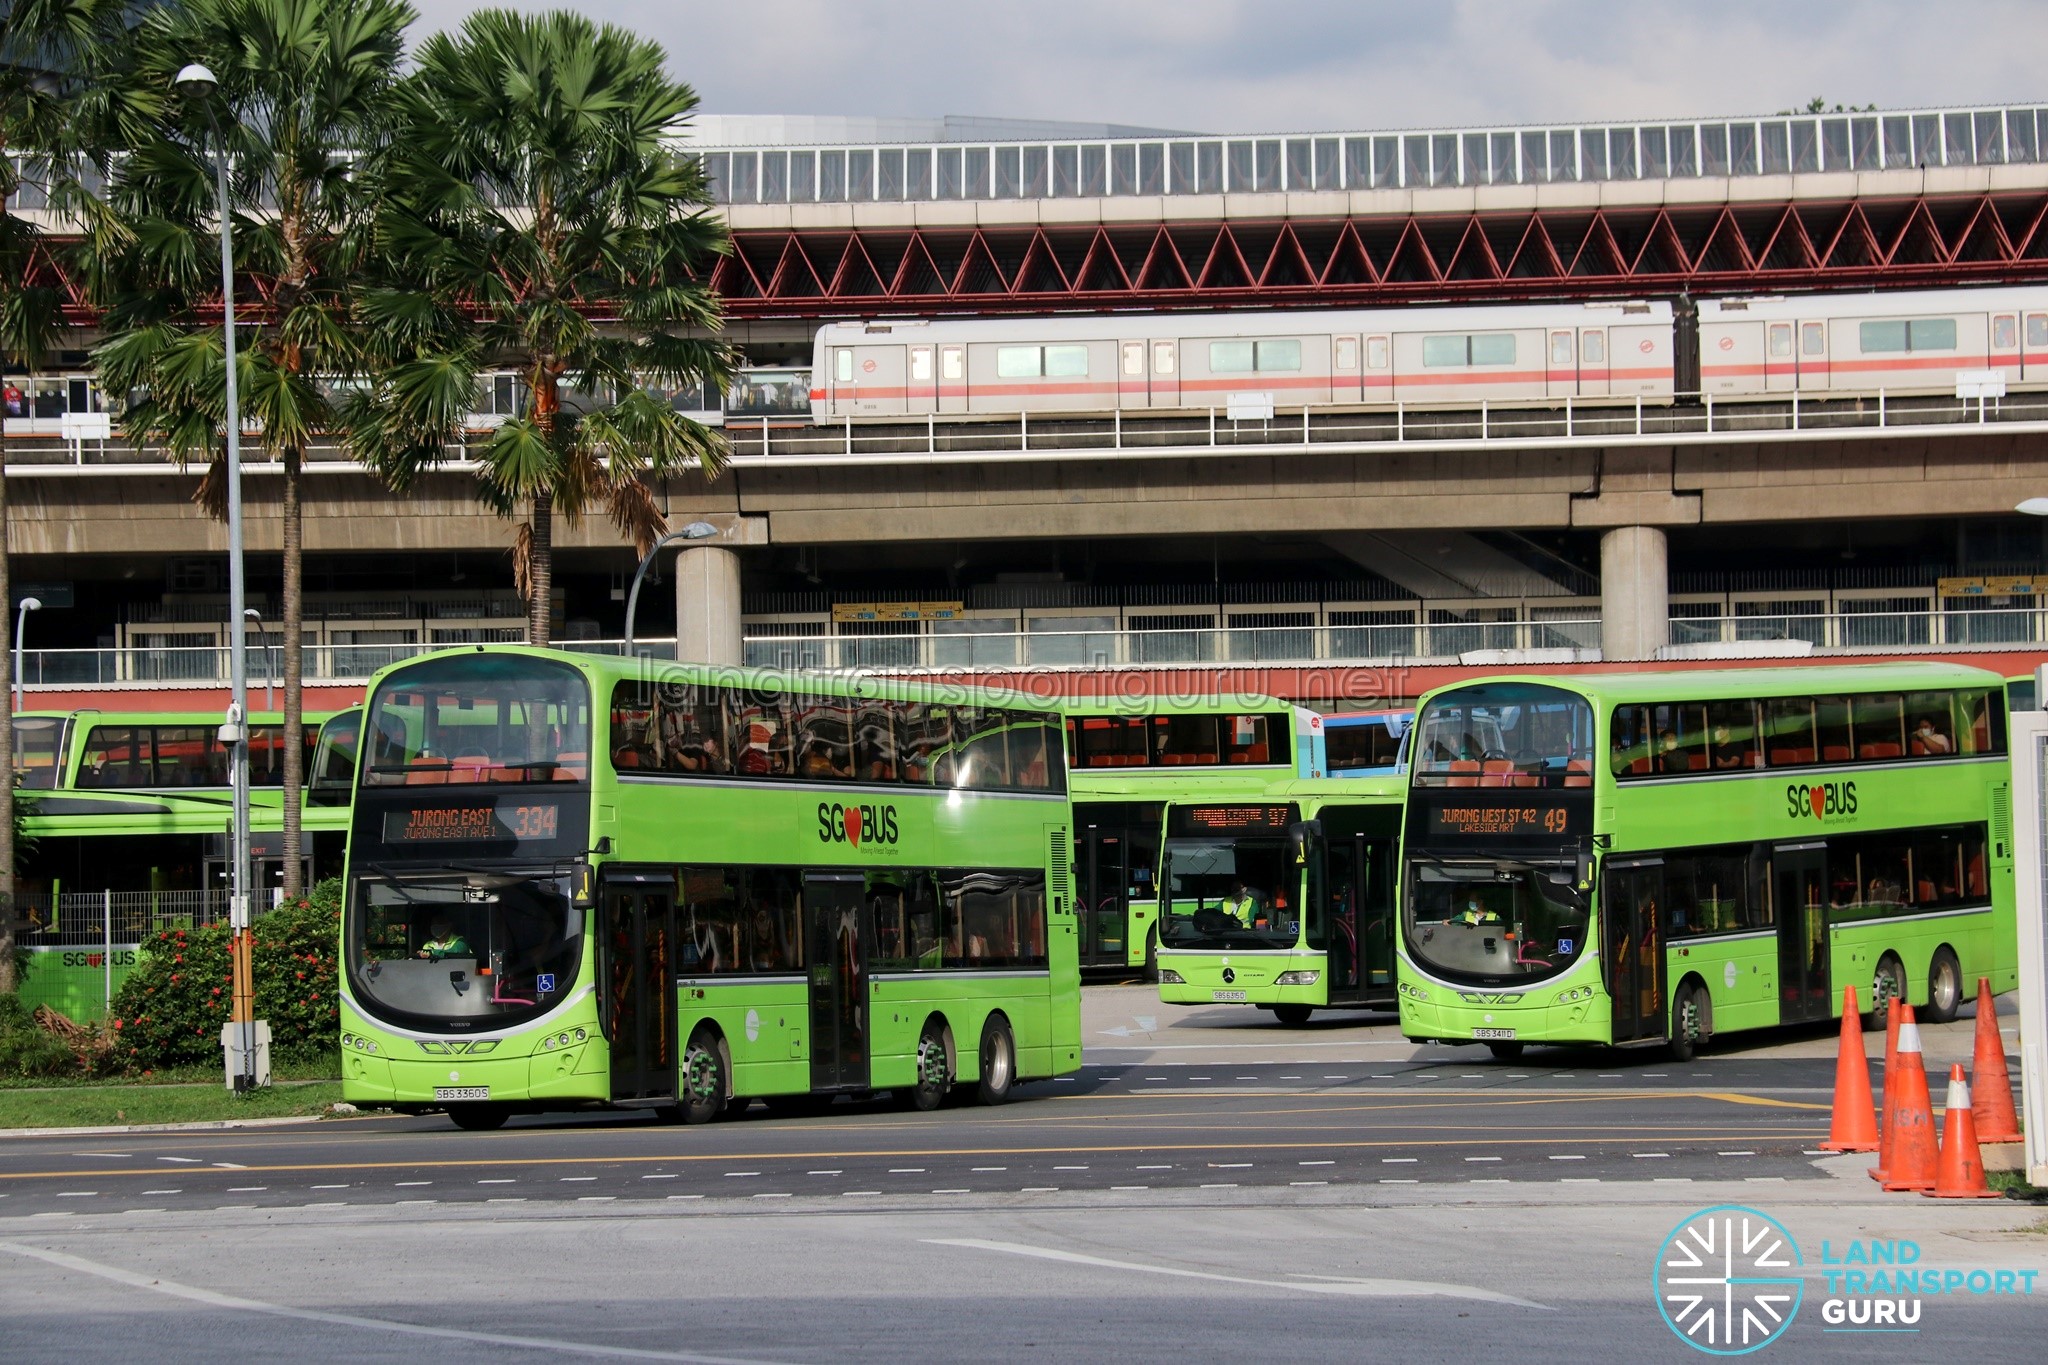
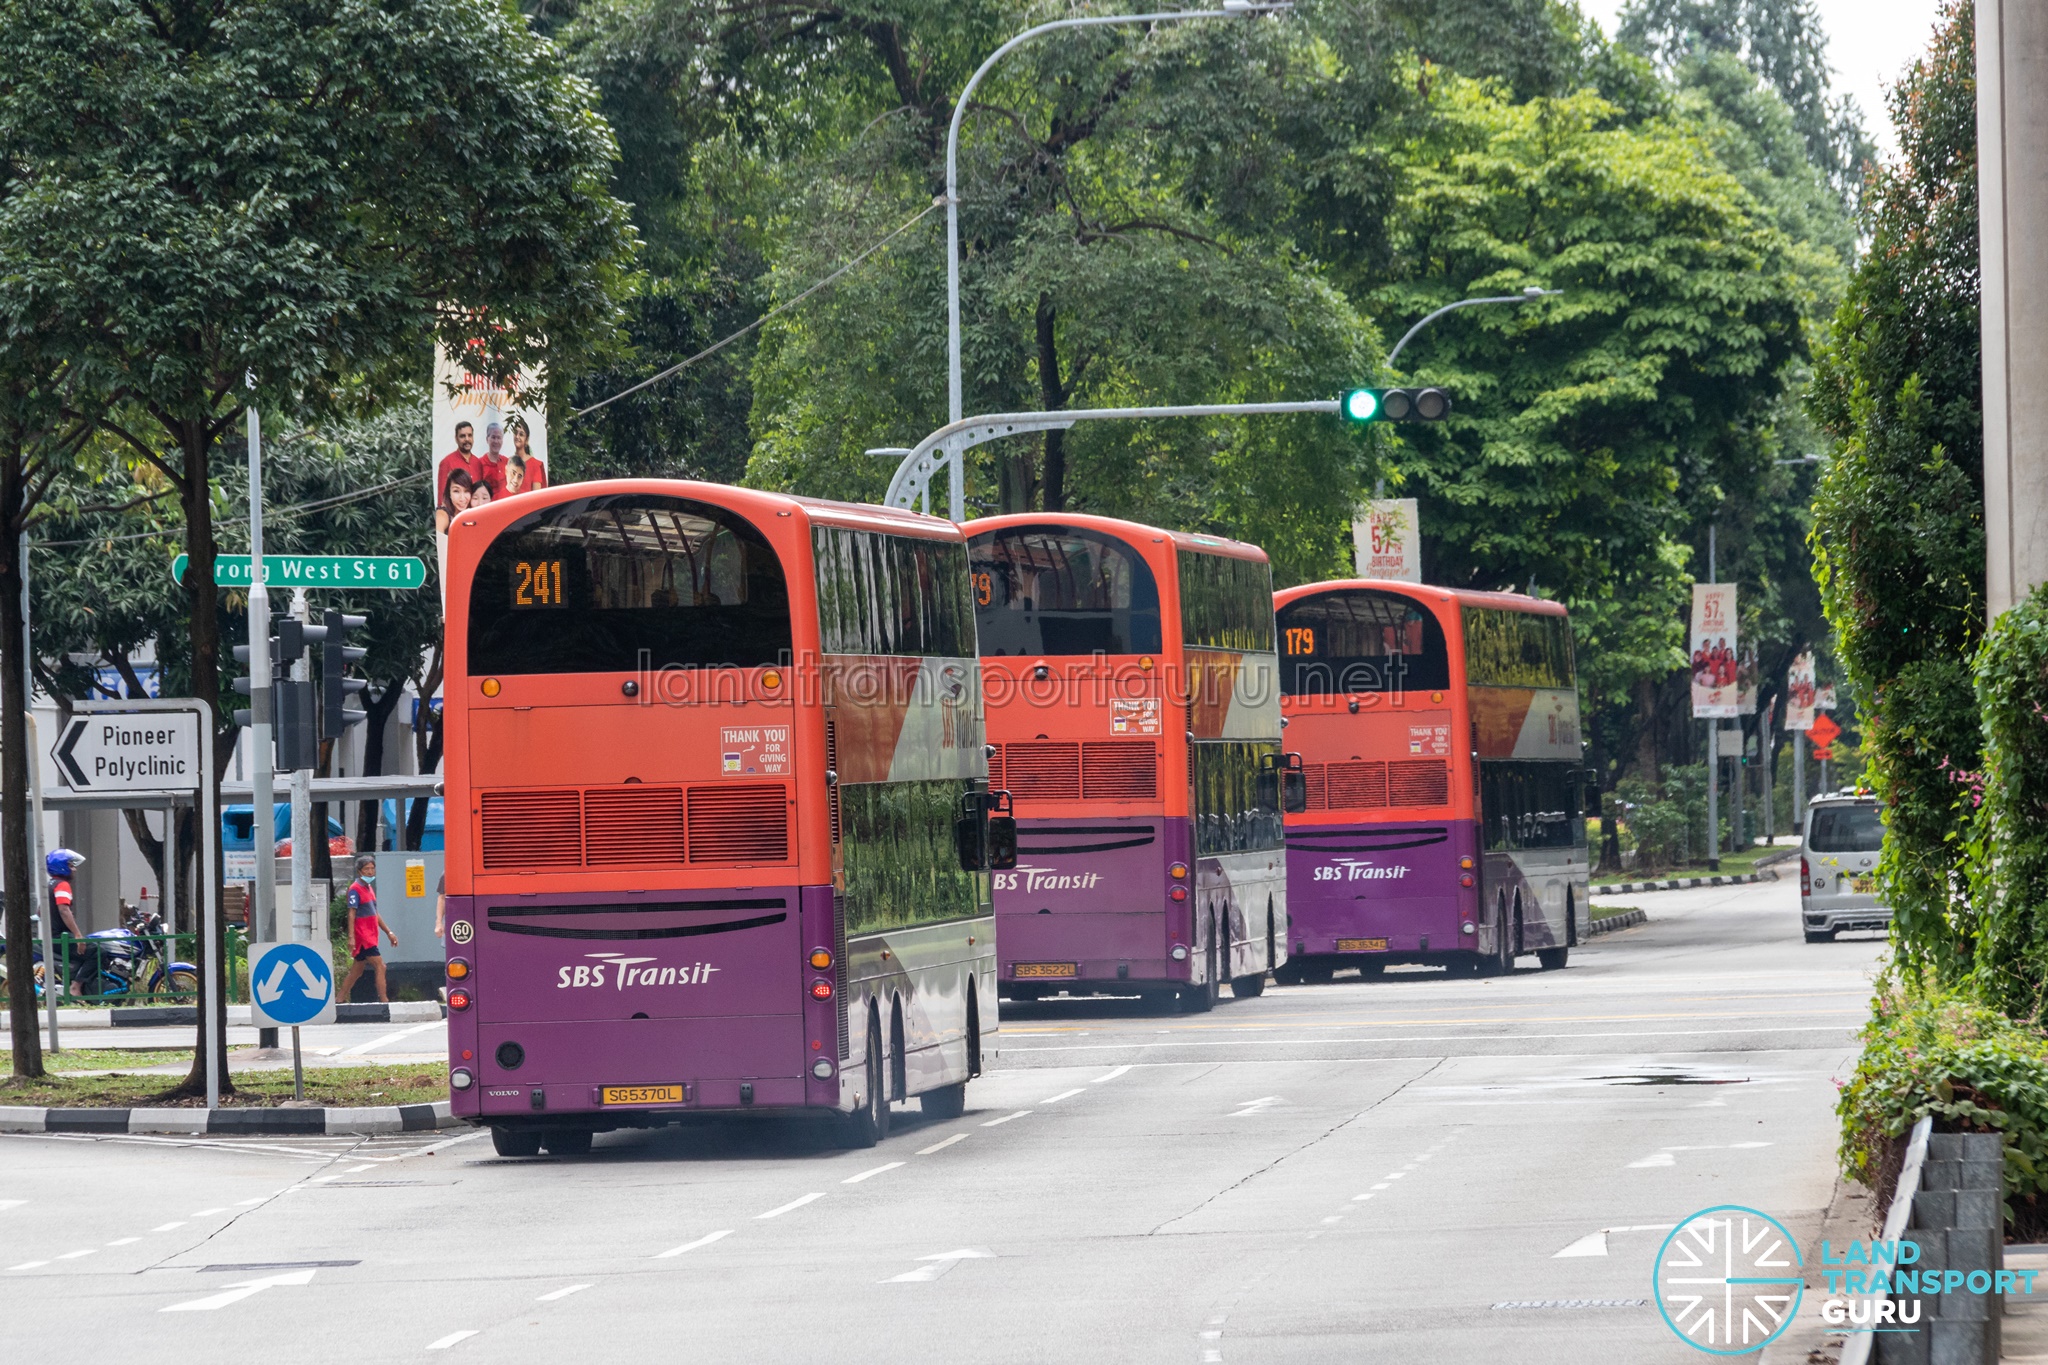
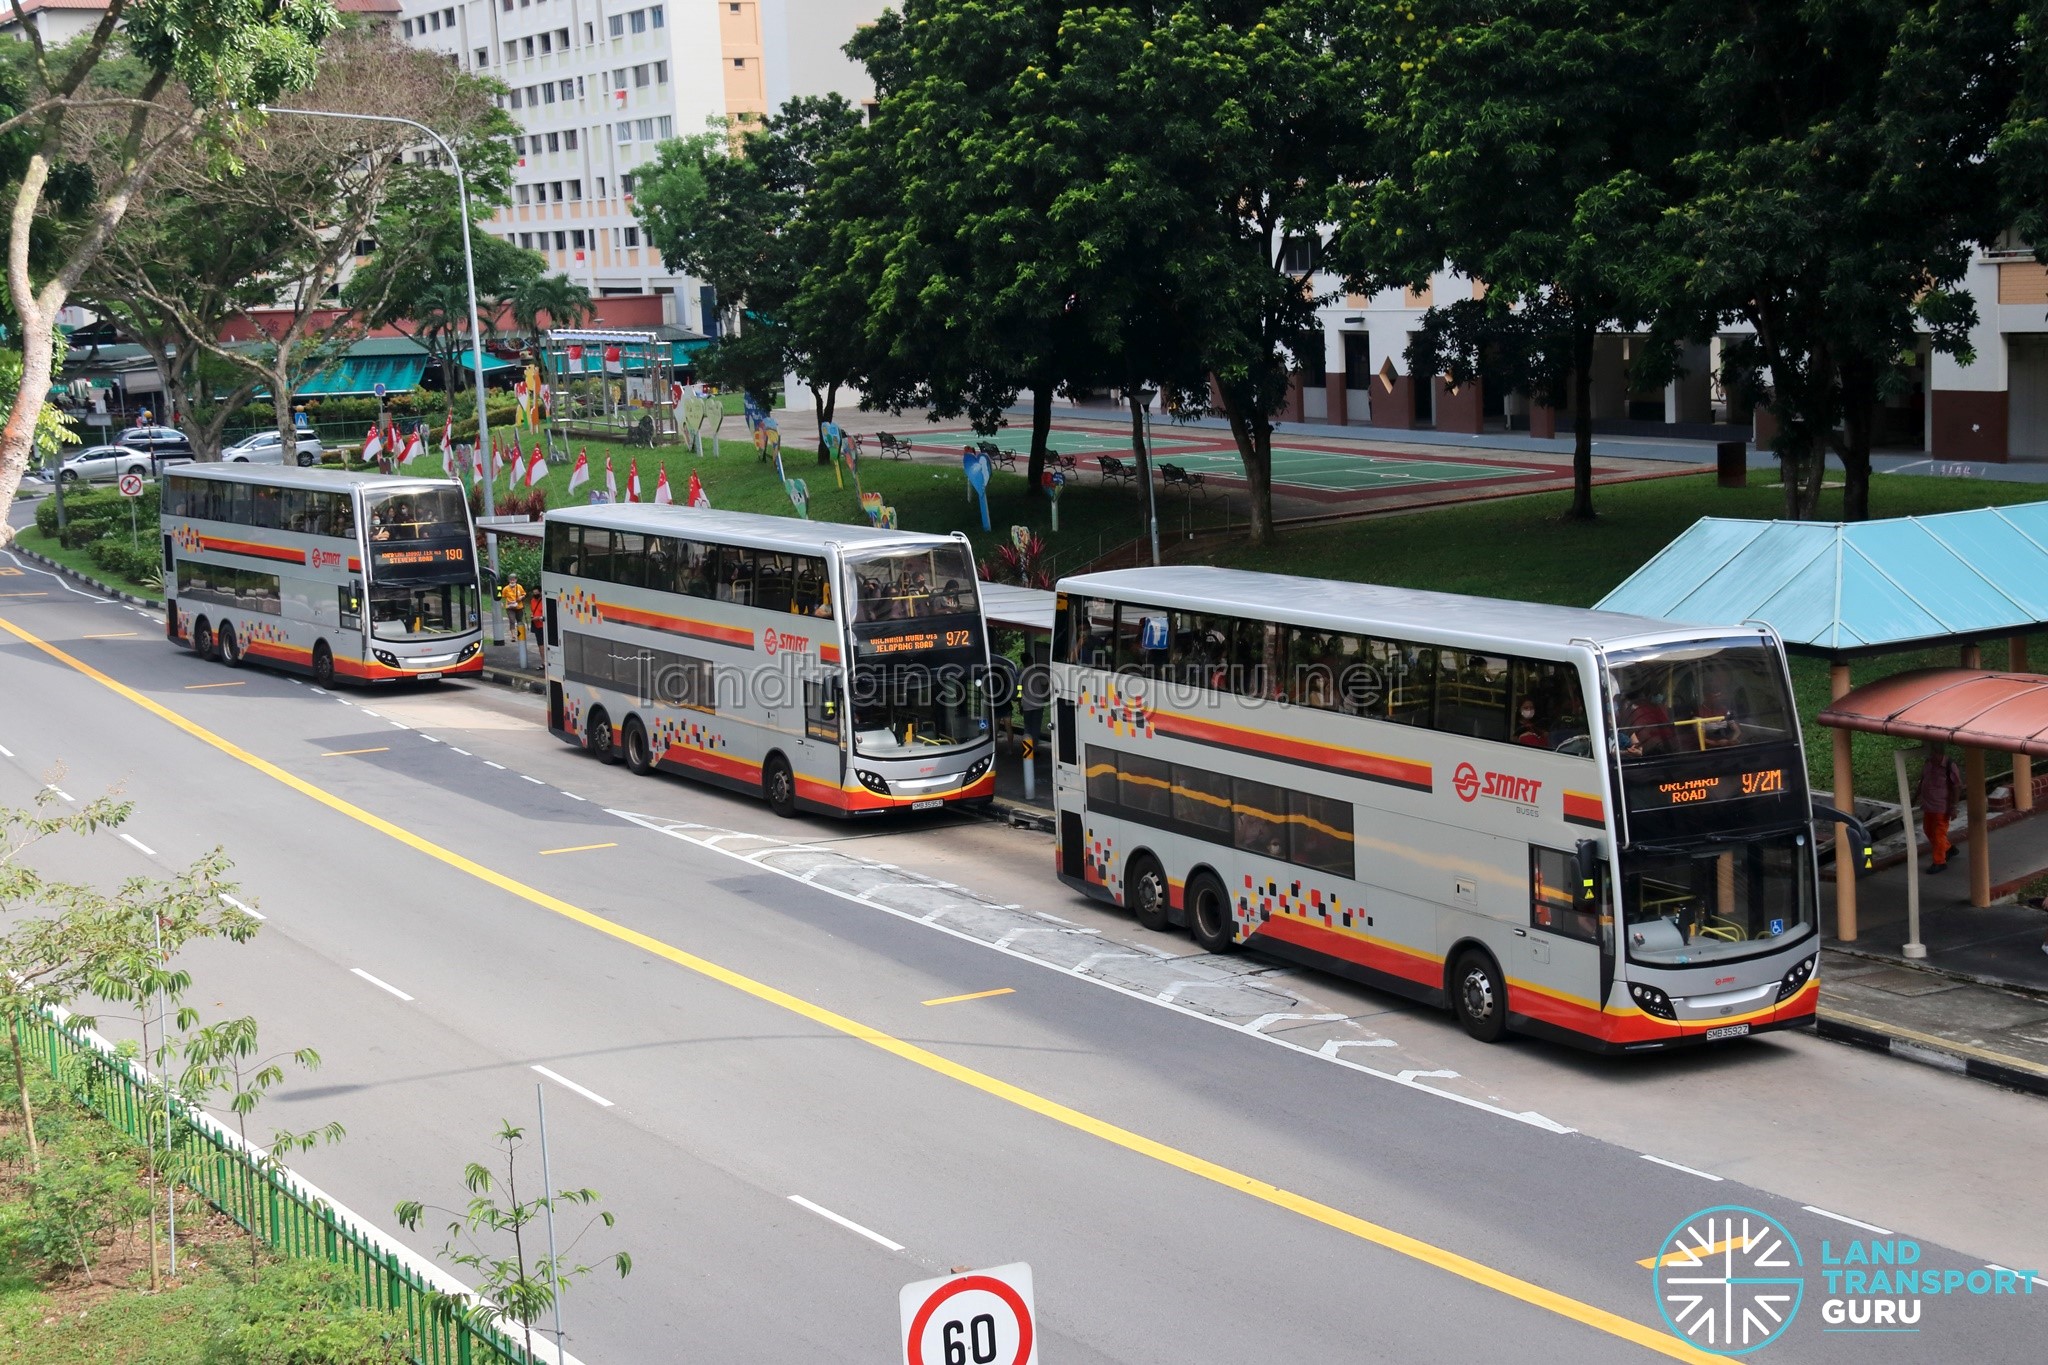
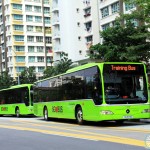
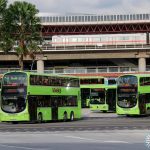
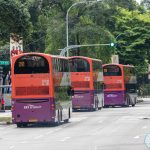
Singapore now has four public bus operators instead of two, with overseas operators having entered the market. The Land Transport Authority (LTA) has considerable flexibility to procure vehicles, introduce new technologies and redesign services as Singapore’s new towns expand and the transport network evolves.
But BCM has also exposed real structural limitations: competition has stayed shallow and is thinning further, not deepening; large geographical packages can constrain the network flexibility BCM was meant to unlock; and taking on far more responsibility for the bus system — the assets, the manpower risk, the cost of every network decision — hasn’t automatically given the Government the institutional agility, or the transparency, to exercise that responsibility visibly well.
Centralising that responsibility for the bus system, e.g. for bus assets and network design, was the right call in several places. But a decade in, it’s fair to ask whether the public can actually see how well that responsibility is being discharged — and on the evidence gathered below, the honest answer is: only partially.
This is a commentary by Land Transport Guru.
Quick Recap
Before BCM, SBS Transit and SMRT Buses operated under Bus Service Operating Licences, owning their own fleets and carrying much of the day-to-day commercial and operational responsibility. The system was already drifting toward greater government involvement — the Bus Service Enhancement Programme (BSEP), introduced in 2012, added capacity and funded improvements ahead of BCM proper.
BCM, which took effect on 1 September 2016, formalised and significantly expanded that shift:

| Pre-2016 | Under BCM | |
| Asset ownership | Operators owned buses and depots | Government owns all buses and depots* * Includes LTA-procured buses and existing operator-owned buses transferred to or leased by LTA under BCM arrangements |
| Route planning | Operators had significant say | LTA centrally plans all routes and service levels |
| Revenue and ridership risk | Borne by operators | Borne by the government |
| Operator role | Owner-operator | Contracted service provider, paid to meet LTA-set standards |
| Competition | Close to none (duopoly) | Competitive tender per package, two-envelope quality-then-price evaluation |
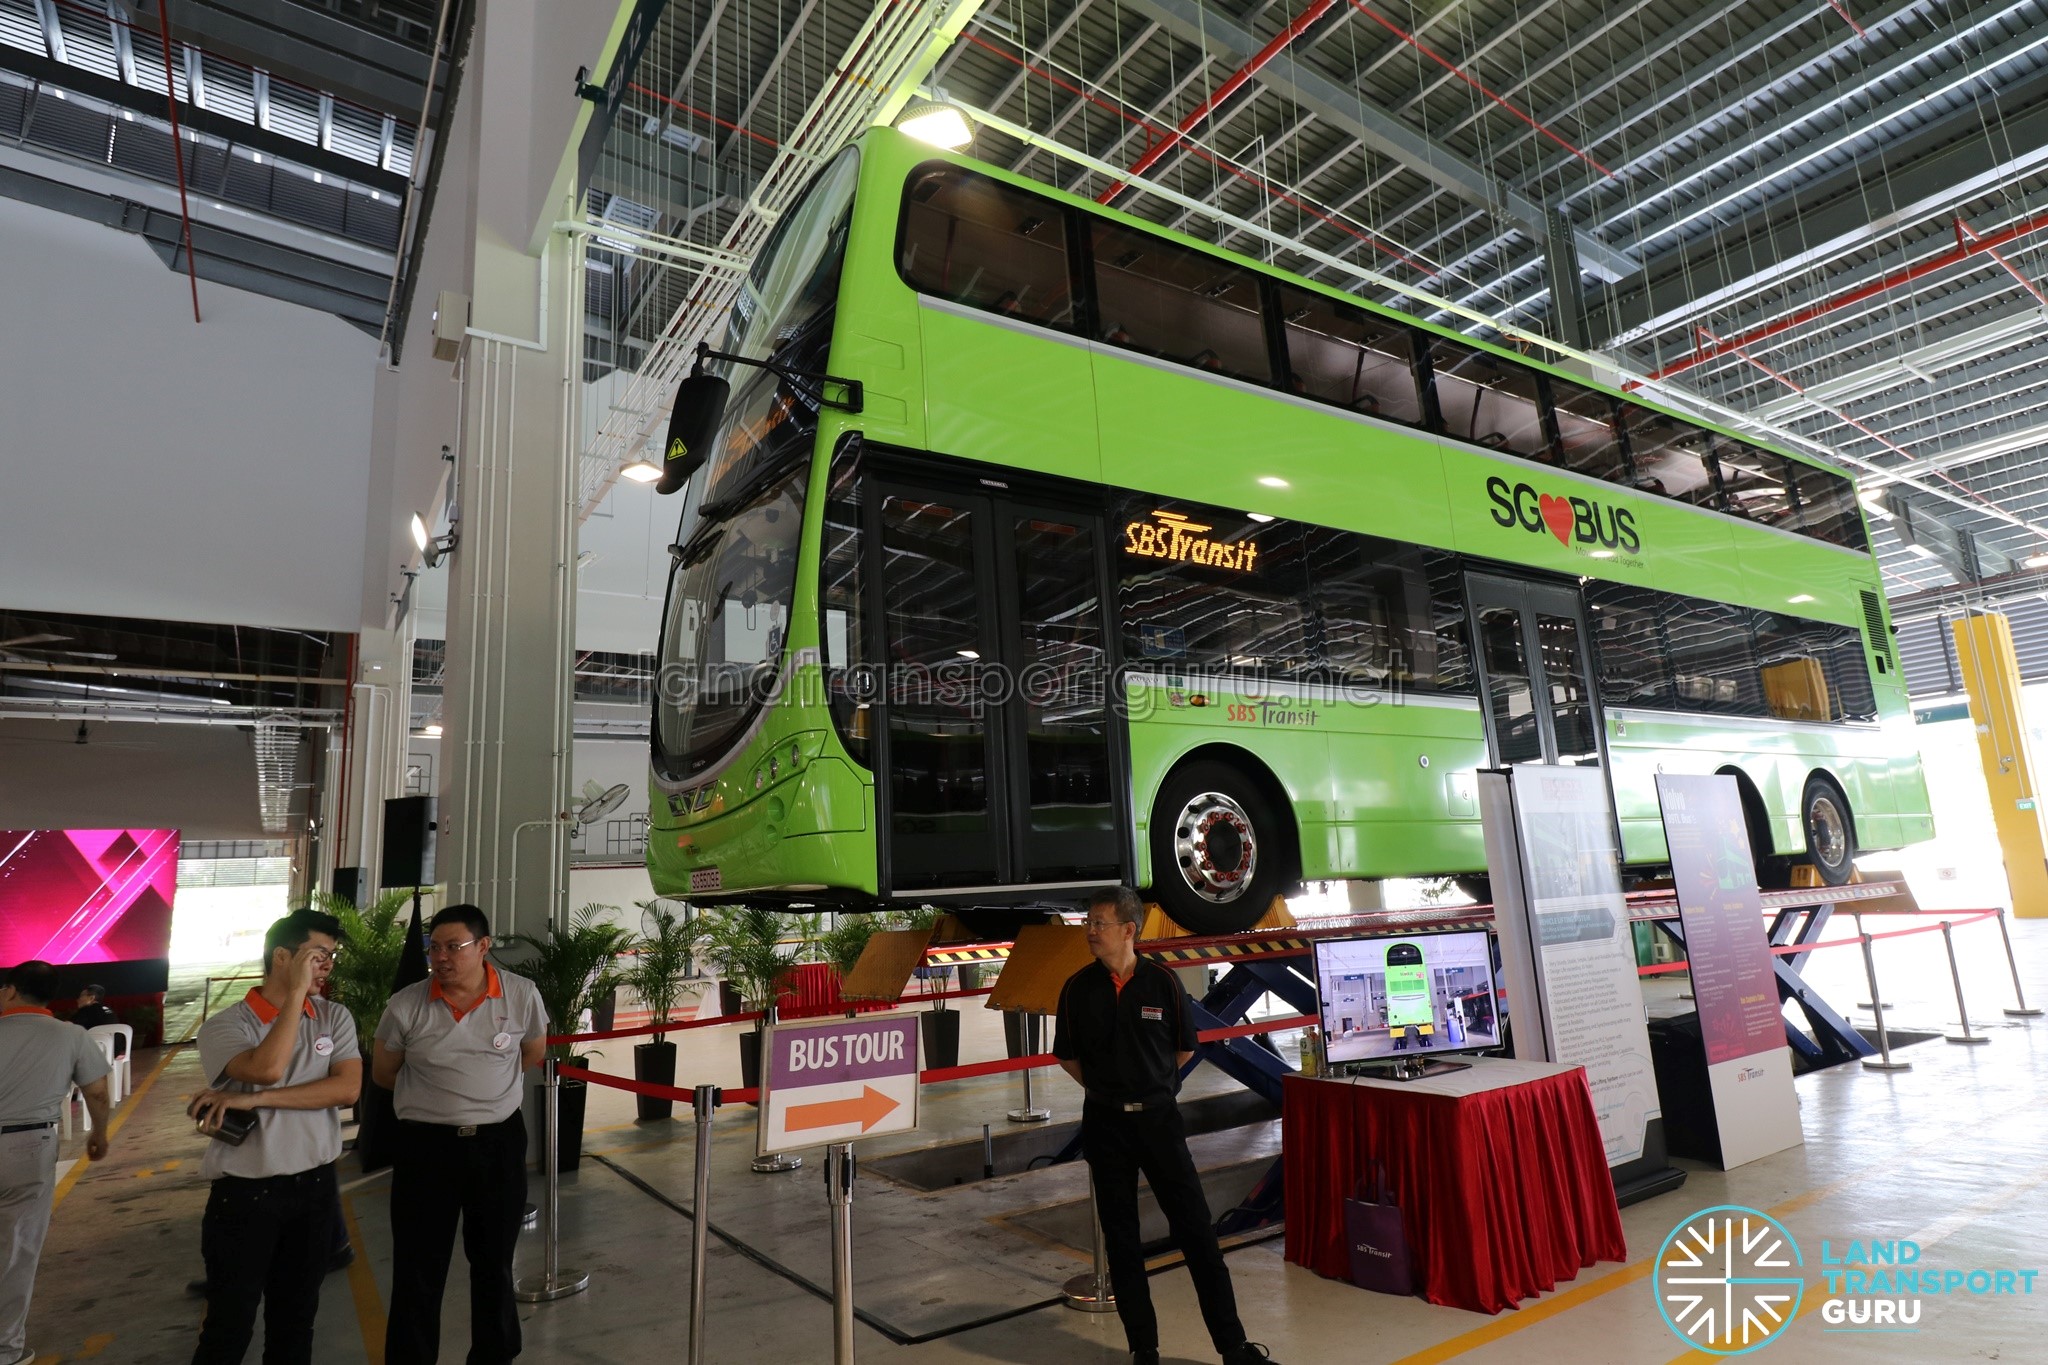
| Branding | Operator liveries | Unified green LTA livery (SG❤️Bus) |
Under the BCM, LTA plans the network, sets service standards, and owns the buses, infrastructure and supporting systems. Operators are paid to run bus services to LTA-prescribed standards, while fare revenue and the broader financial risks of operating the network sit with the Government.
The model was intended to:
- give the Government greater control over the network
- make bus services more responsive to changes in demand and commuter needs
- introduce competition between operators, and
- raise service standards
Ten years on, these institutional changes are arguably BCM’s clearest legacy: Singapore has moved from a system where operators shaped and invested in their own networks, to one where the Government commissions the network and purchases service delivery from competing operators. The stakes are considerable — in 2025, Singapore recorded an average of 3.84 million daily bus trips, representing 50.9% of total public transport ridership, even with bus ridership still below pre-pandemic levels.
What BCM has delivered
1. Substantially greater Government control
The BCM shifts network planning and asset control entirely to the LTA, leaving operators to focus strictly on contract delivery. This structure allows the Government to design the network holistically. LTA can commission socially necessary routes for their network value, even if they are not commercially viable on their own.
This model also aligns directly with Singapore’s broader transport strategy. Given strict, long-standing car ownership restraint policies—such as the Certificate of Entitlement (COE) system and the zero vehicle growth policy—public transport must serve as a highly reliable and attractive alternative to private transport to sustain economic mobility.
Buses play a critical role within this ecosystem by complementing the expanding Mass Rapid Transit (MRT) network. For first-and-last-mile connectivity, optimised feeder bus routes link residential areas directly to major MRT nodes. Buses also provide connections between towns, and along corridors where building heavy rail infrastructure is absent or inefficient, filling geographic gaps in the rail network.
2. Room for operators to differentiate
Competition incentivises public transport operators to differentiate themselves. To secure high-quality scores in the two-envelope evaluation framework, operators actively innovate beyond simply running buses from A to B. These differentiators focus primarily on community inclusion, accessibility, and safety technology. A few standouts are:
- SBS Transit: Developed the “Find Your Way” visual wayfinding system in partnership with Dementia Singapore; implemented fleetwide Mobileye ADAS; and established a dedicated Bus Captain Training and Certification Centre at Ulu Pandan Depot.
- SMRT Buses: Introduced the Go-To SMRT commuter-support programme (calm spaces, dementia go-to points) at bus interchanges; pioneered early adoption of fleetwide telematics; launched the “Bus 4.0” Intelligent Operations Control Centre at Gali Batu Depot.
- Tower Transit: Introduced GreenRoad telematics credited with reducing accident rates; raised basic Bus Captain pay above S$2,000 in 2017, pushing up industry-wide wage baselines; deployed 360-degree camera systems and introduced badge-authenticated bus start inhibitors in 2024.
- Go-Ahead: Launched the “Helping Hand” accessibility scheme; deployed predictive-maintenance Vehicle Health Telematics from 2020; conducted solar-panel trials on diesel buses as a sustainability measure.
List of BCM-era Operator initiatives and Technologies (Click to expand)
| Community / CSR initiatives: | Technology / Safety: | |
| SBS Transit | • “Find Your Way” initiative in collaboration with Dementia Singapore to assist with wayfinding [Link]
• Introduced Work Study Diploma Programme in Land Transport Engineering with ITE in 2022 [Link] • Repurposed a retired Volvo B9TL donated to ITE College West as a Bus Engineering Lab in 2023 [Link] • Handbrake Audio Alert System in 2023 [Link] • Launched MAGIC CARES Van Community Programme in 2019 [Link] and CARES Community Bus in 2023 [Link] • School-Friendly Public Bus Service Trial [Link] and AED-on-Buses programme [Link] in 2024 • Smart bus braking system in 2026 [Link] • Public Transport Inclusivity Training Centre at Seletar Bus Depot, Apr 2026 [Link] |
• Fleetwide adoption of Mobileye Collision Avoidance System between 2016 and 2019
• Opened Bus Technical Specialist Certification Centre and Bus Captain Training and Certification Centre (BCTCC) at Ulu Pandan Depot in 2018 and 2024 respectively [Link] • Trialled Golden Eye anti-fatigue in 2019; 30% of fleet equipped by end-2024 [Link] • Trialled digital side mirrors in 2023 • Launched Mobility Innovation Centre in 2024 [Link] • Launched Trial of Agil DriveSafe+in 2024 [Link] • Showcased AI-enabled security solutions [Link] • Trial of responsive and adaptive braking system in 2026 [Link] • Launched Project ELEVATE to boost BC welfare levels [Link] |
| SMRT Buses | • WeCare concierge service launched at BPITH in 2017 [Link]
• Converted buses to dedicated COVID-19 Patient Transport Vehicles in 2020 [Link] • Go-To SMRT initiative launched in 2021 at bus interchanges, offering enhanced commuter services and facilities, including calm spaces (WeCare rooms) and Dementia Go-To Points [Link] • Launched the Navilens app in 2022 and wayfinding floor/wall murals in 2024 to aid the visually impaired and commuters with dementia, respectively [Link] [Link] • Ongoing CSR initiatives include Tap For Hope annual charity drive, Nodes @ SMRT partnership with the National Library Board (NLB), and SMRT Green Learning Trail walking tour [Link] |
• Pre-BCM: Launched telematics system with NEC in 2012 [Link] and Bus Training and Evaluation Centre (BTEC) in 2015 [Link]
• Launched Bus Captain Management System (BCMS+) app in 2024 to digitise BC’s daily tasks [Link] • AI‑enabled bus lane violation detection system in 2025 [Link] • In-house Bus Captain Risk Profiling System analytics tool in 2026 [Link] • Launched Intelligent Operations Control Centre (iOCC) in 2026, alongside refreshed telematics system and a suite of AI-enabled features, dubbed “Bus 4.0” [Link] |
| Tower Transit | • Trialled ‘signature scent’ on 100 buses in 2017 [Link]
• Launched study grants for SUSS students in 2020 [Link] • Hired an Inclusivity Officer in 2020 [Link] [Link] • CARE Buses with artwork by the disabled in 2024 [Link] • AED-on-Buses programme started in 2025 [Link] • Launched Wedding Concept Bus in 2026 [Link] • Pilot programme to help older bus drivers transition into other roles in 2026 [Link] • Ongoing Public Bus Confidence Course [Link] and Public Bus Inclusivity Course [Link] to support the mobility-challenged |
• Launched GreenRoad telematics system in 2016, reducing accident rates [Link]
• First to raise BC’s basic pay to over S$2000 in 2017, launched TowerCARE staff welfare and engagement program [Link][Link] • Launched Engineering Centre of Excellence in 2018 [Link] • Trialled on-demand employee bus services in 2019 [Link] • Retrofitted 360-degree Surround View Camera systems to all buses starting in 2021 [Link] • Deployed bus start inhibitors in 2024, authenticated by BC’s employee badge [Link] • Implemented Mid-Route Driver Swaps on Bus 858 to Boost Safety [Link] |
| Go-Ahead | • Piloted the “Helping Hand” scheme on its bus services in 2020 [Link]
• Self-service Kiosk at Pasir Ris Int in 2021 [Link] • Partnership with Cerebral Palsy Alliance Singapore [Link] and launched CARE bus in 2022 [Link] • Installed a green wall at Punggol Int and embraced sustainable initiatives [Link] |
• Launched GreenRoad telematics system in 2017 [Link]
• Deployed BC Click mobile app in 2018 to digitise BC’s daily tasks [Link] • Trialled EB Ride on-demand employee bus services in 2019 [Link] • Launched the Vehicle Health Telematics (VHT) system in 2020 to bolster predictive maintenance regimes [Link] • Trialled ultrathin solar panels on two buses in 2021, expanding to 50 more in 2023 [Link] |
Although these CSR and technology initiatives sit outside BCM’s core purpose, they show how competition encourages differentiated approaches within a common regulatory framework. The competitive dynamic has also extended beyond the 14 core packages: Tower Transit separately won a five-year contract to operate and maintain buses on Sentosa Island.
3. Early improvements in service levels
BCM’s early years delivered substantial, documented improvements. By 2017, the Ministry of Transport reported that maximum scheduled peak-hour headway had fallen from 20 to 15 minutes, feeder services had tightened to 6–8 minutes, and average excess waiting time had dropped 25% across 290 services.
By 2019, LTA reported over 2,000 additional buses since 2014, 15 new services introduced, and 75% of services less crowded at peak. These figures make a strong case that BCM, combined with the wider BSEP-era investment, produced tangible capacity gains — though as covered later, off-peak service levels have since slipped.
4. An early satisfaction bump — since plateaued
The Public Transport Customer Satisfaction Survey recorded a mean score of 7.6/10 in 2016, rising to 7.9 in 2017 and holding there through 2018; PTC attributed part of the improvement to BCM, citing greater operator competition and the new regularity standards. The score held around 7.8 from 2019–2022 before easing to 7.7 in 2023–2024 — a plateau and slight decrease, worth keeping in view against the sections below.
5. Central ownership as active fleet management — not just static ownership
Centralised asset ownership allows LTA to use the public bus fleet as a dynamic policy lever rather than just a static asset pool. Under the previous operator-owned model, transport firms lacked the commercial incentive to retire vehicles early and write off their residual value. Under the BCM, LTA absorbs these transitional costs to achieve broader public objectives.
For instance, LTA achieved a 100% wheelchair-accessible public bus fleet on 1 December 2020 by retiring the final remaining non-accessible buses several months ahead of their statutory lifespans.
Likewise, in January 2022, as part of the same Framework Agreement that shifted the Downtown Line to the New Rail Financing Framework (NRFF) Version 2, SBS Transit retired 241 buses early, comprising 144 double-deck Volvo B9TL (CDGE) and 97 single-deck Scania K230UB (Euro IV), at 76.5–91.1% of their 17-year statutory lifespan. These were replaced with newer buses leased from LTA, which were judged more environmentally friendly and cheaper to maintain.
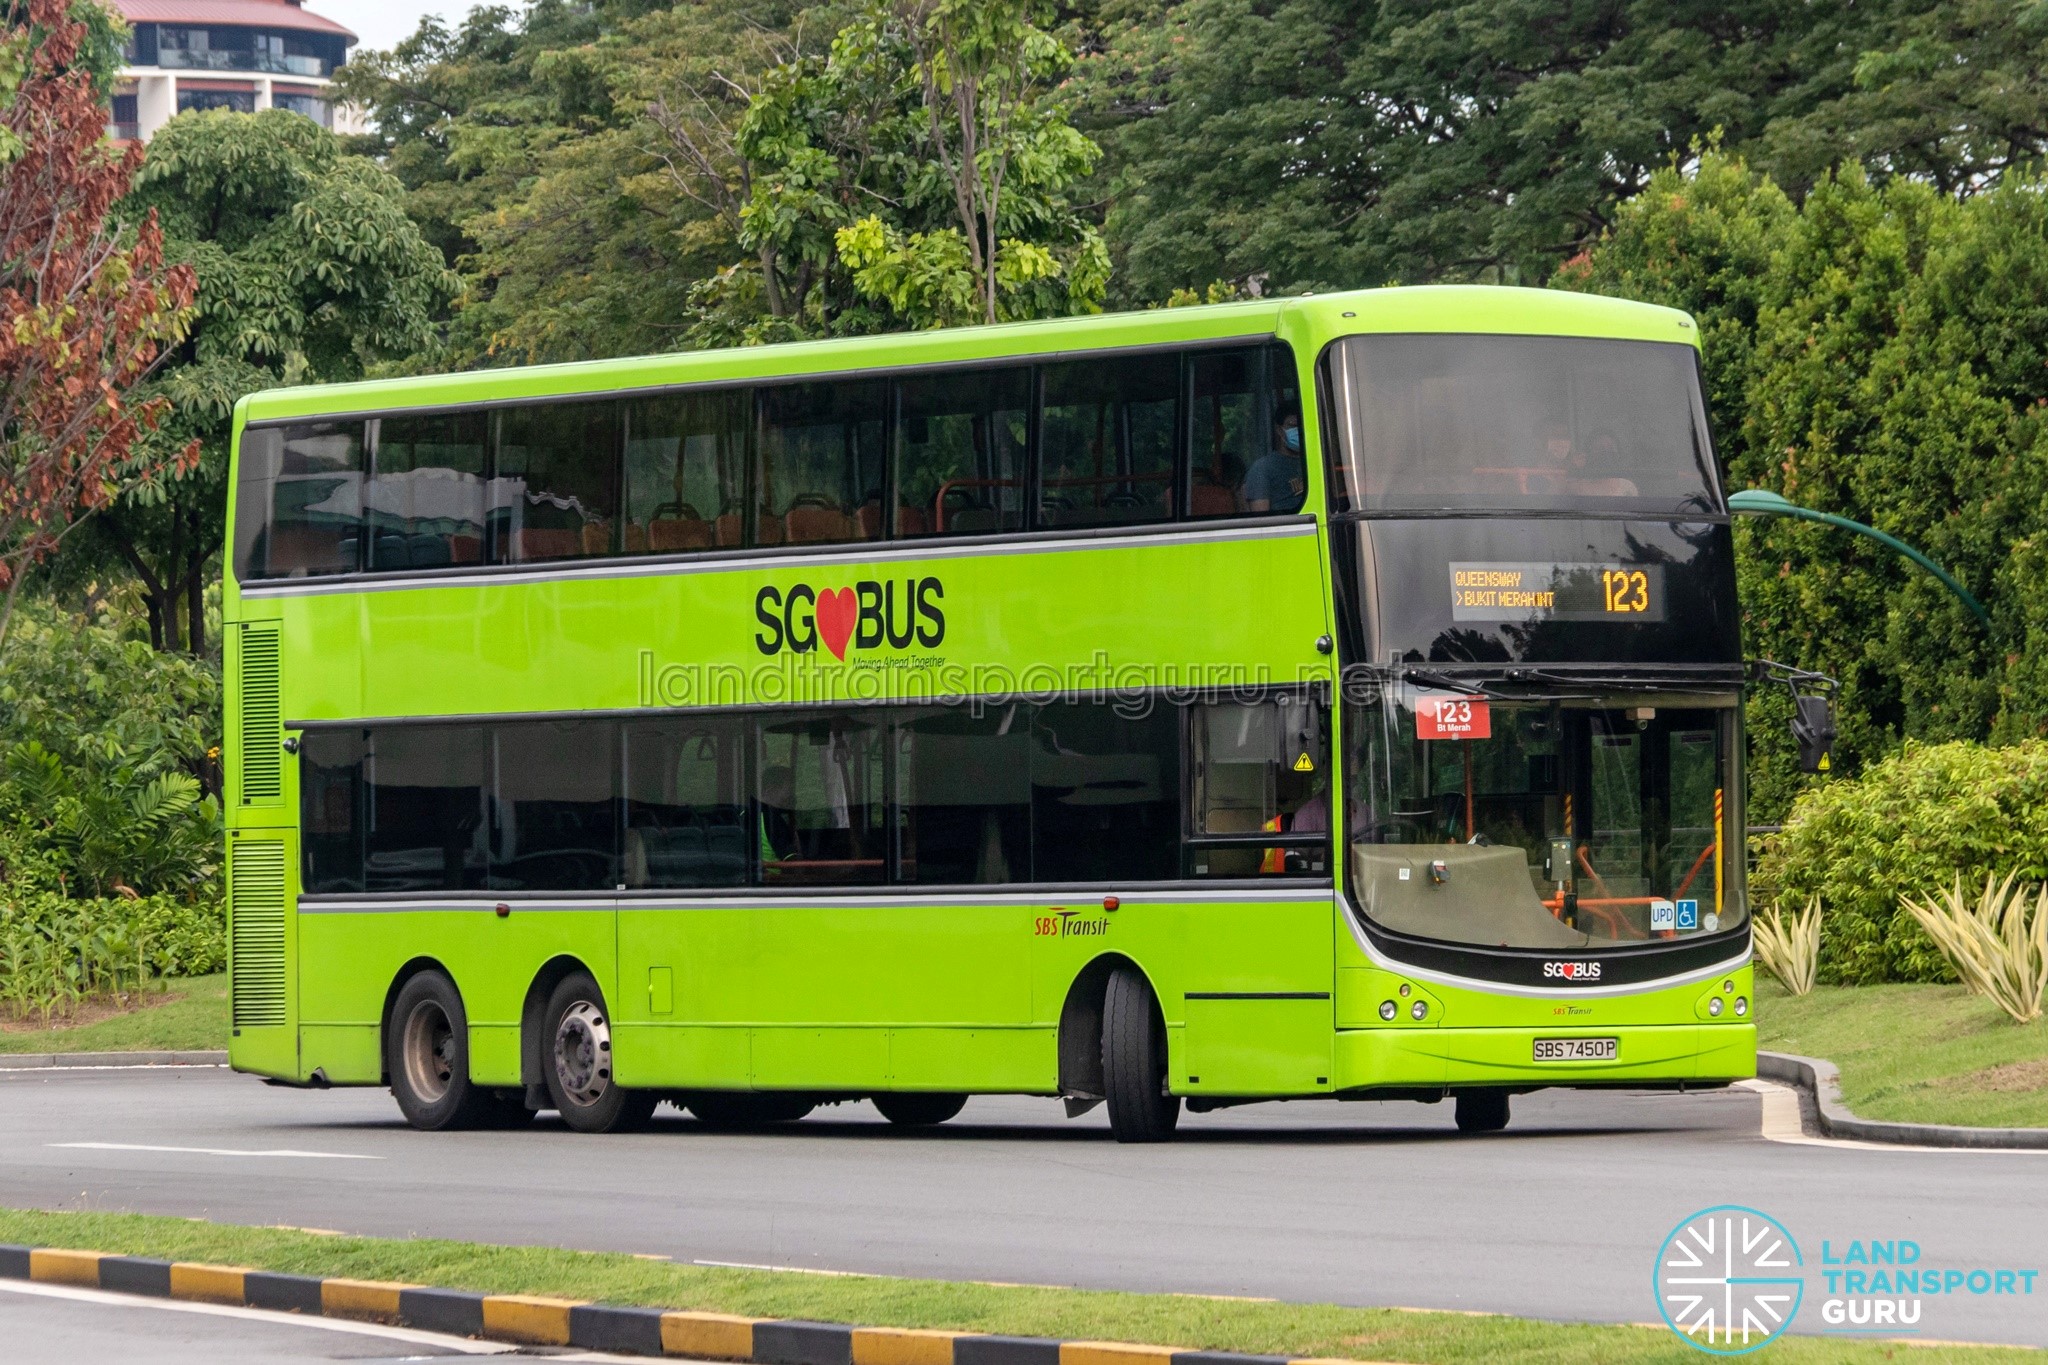
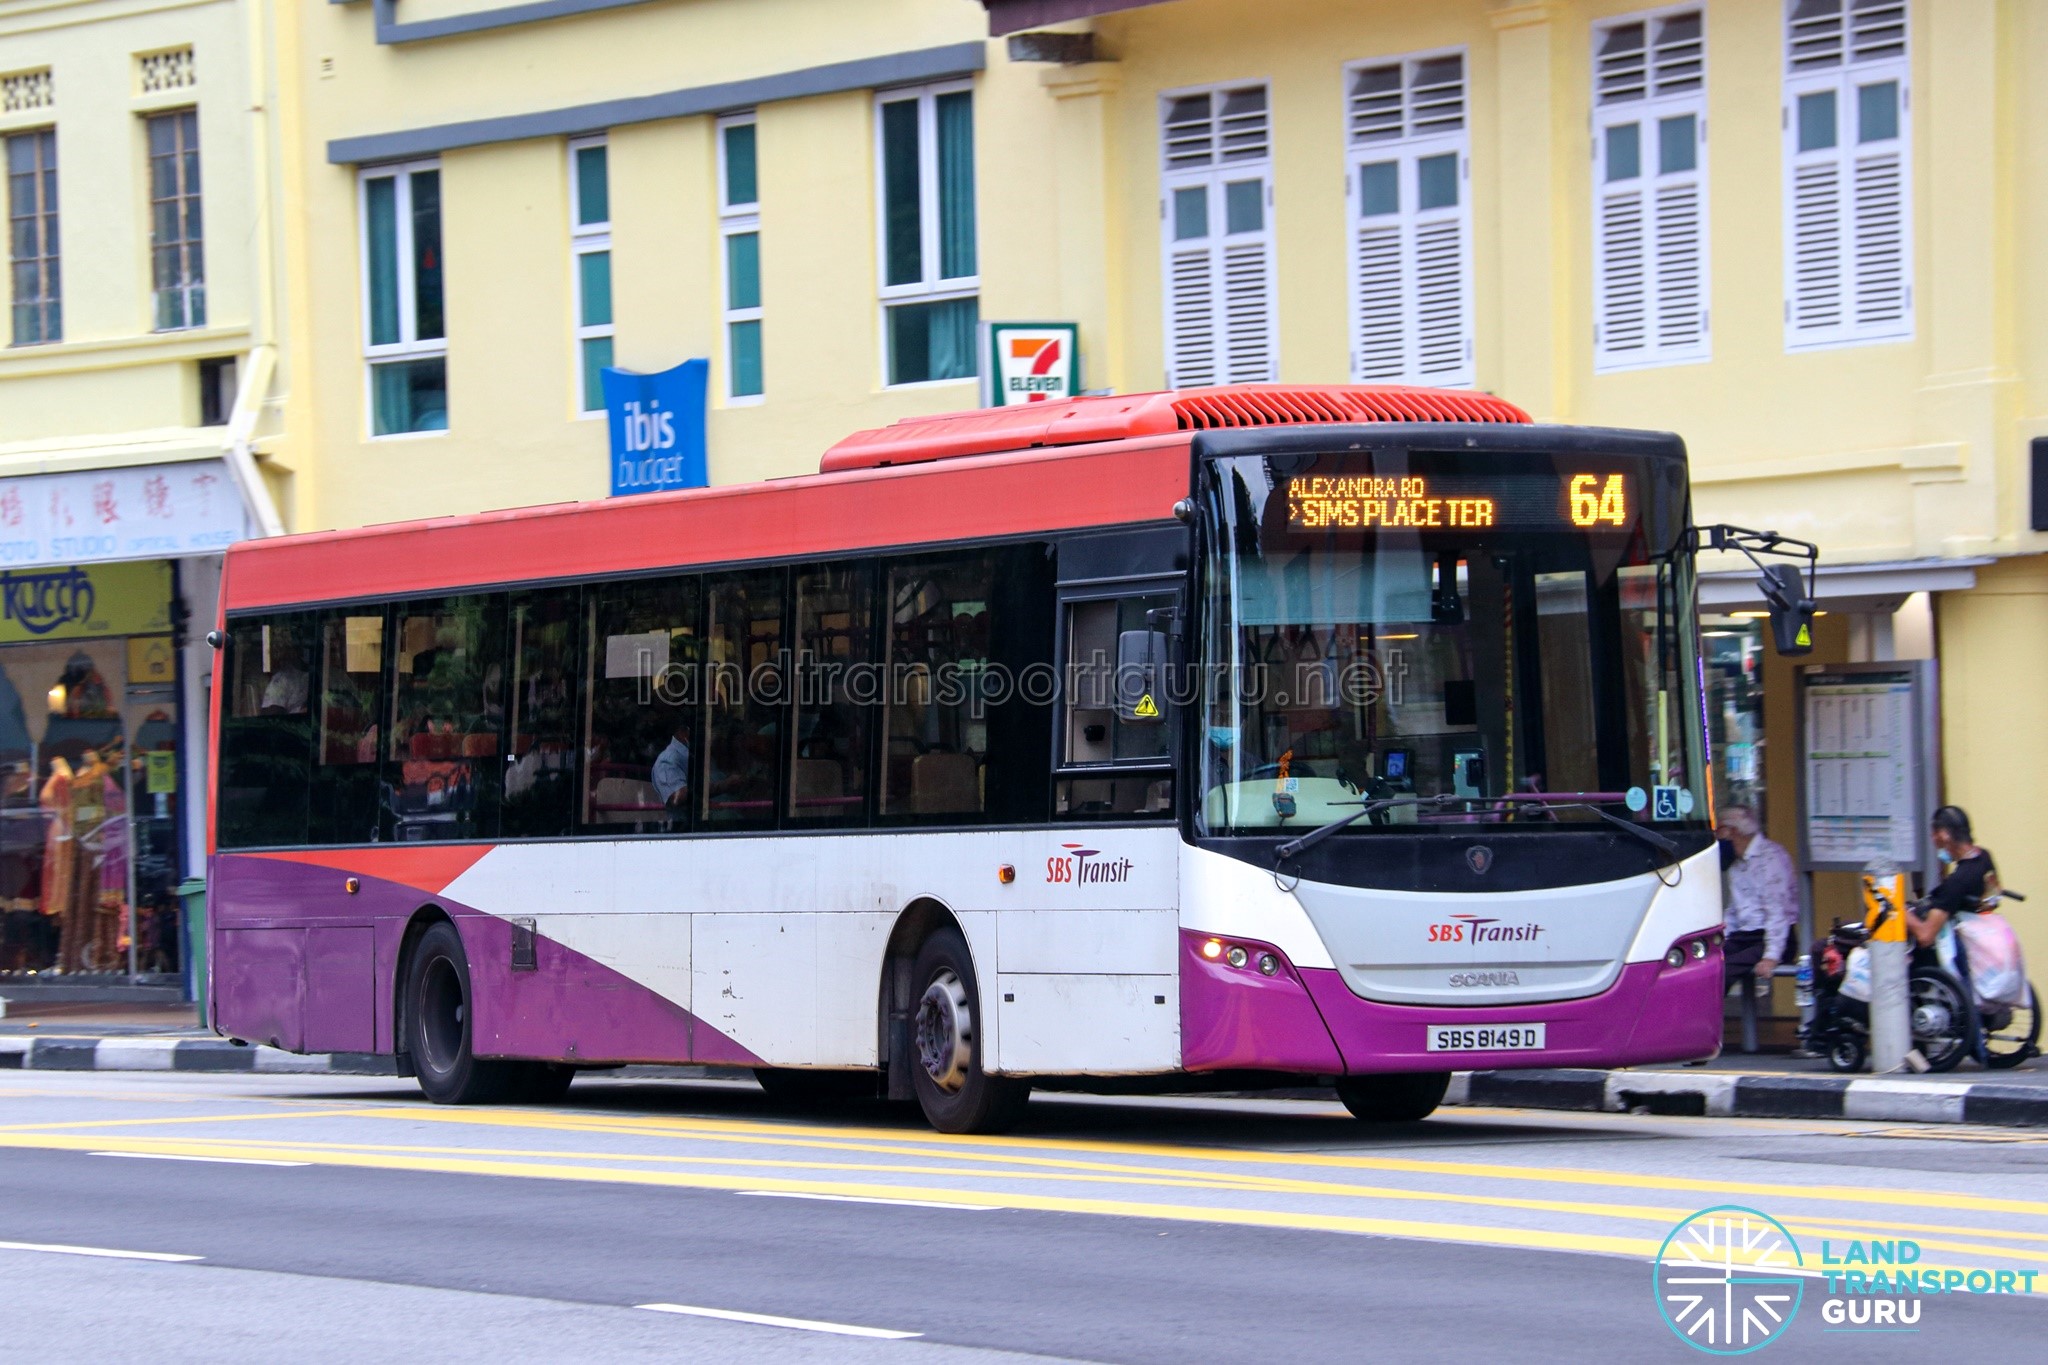
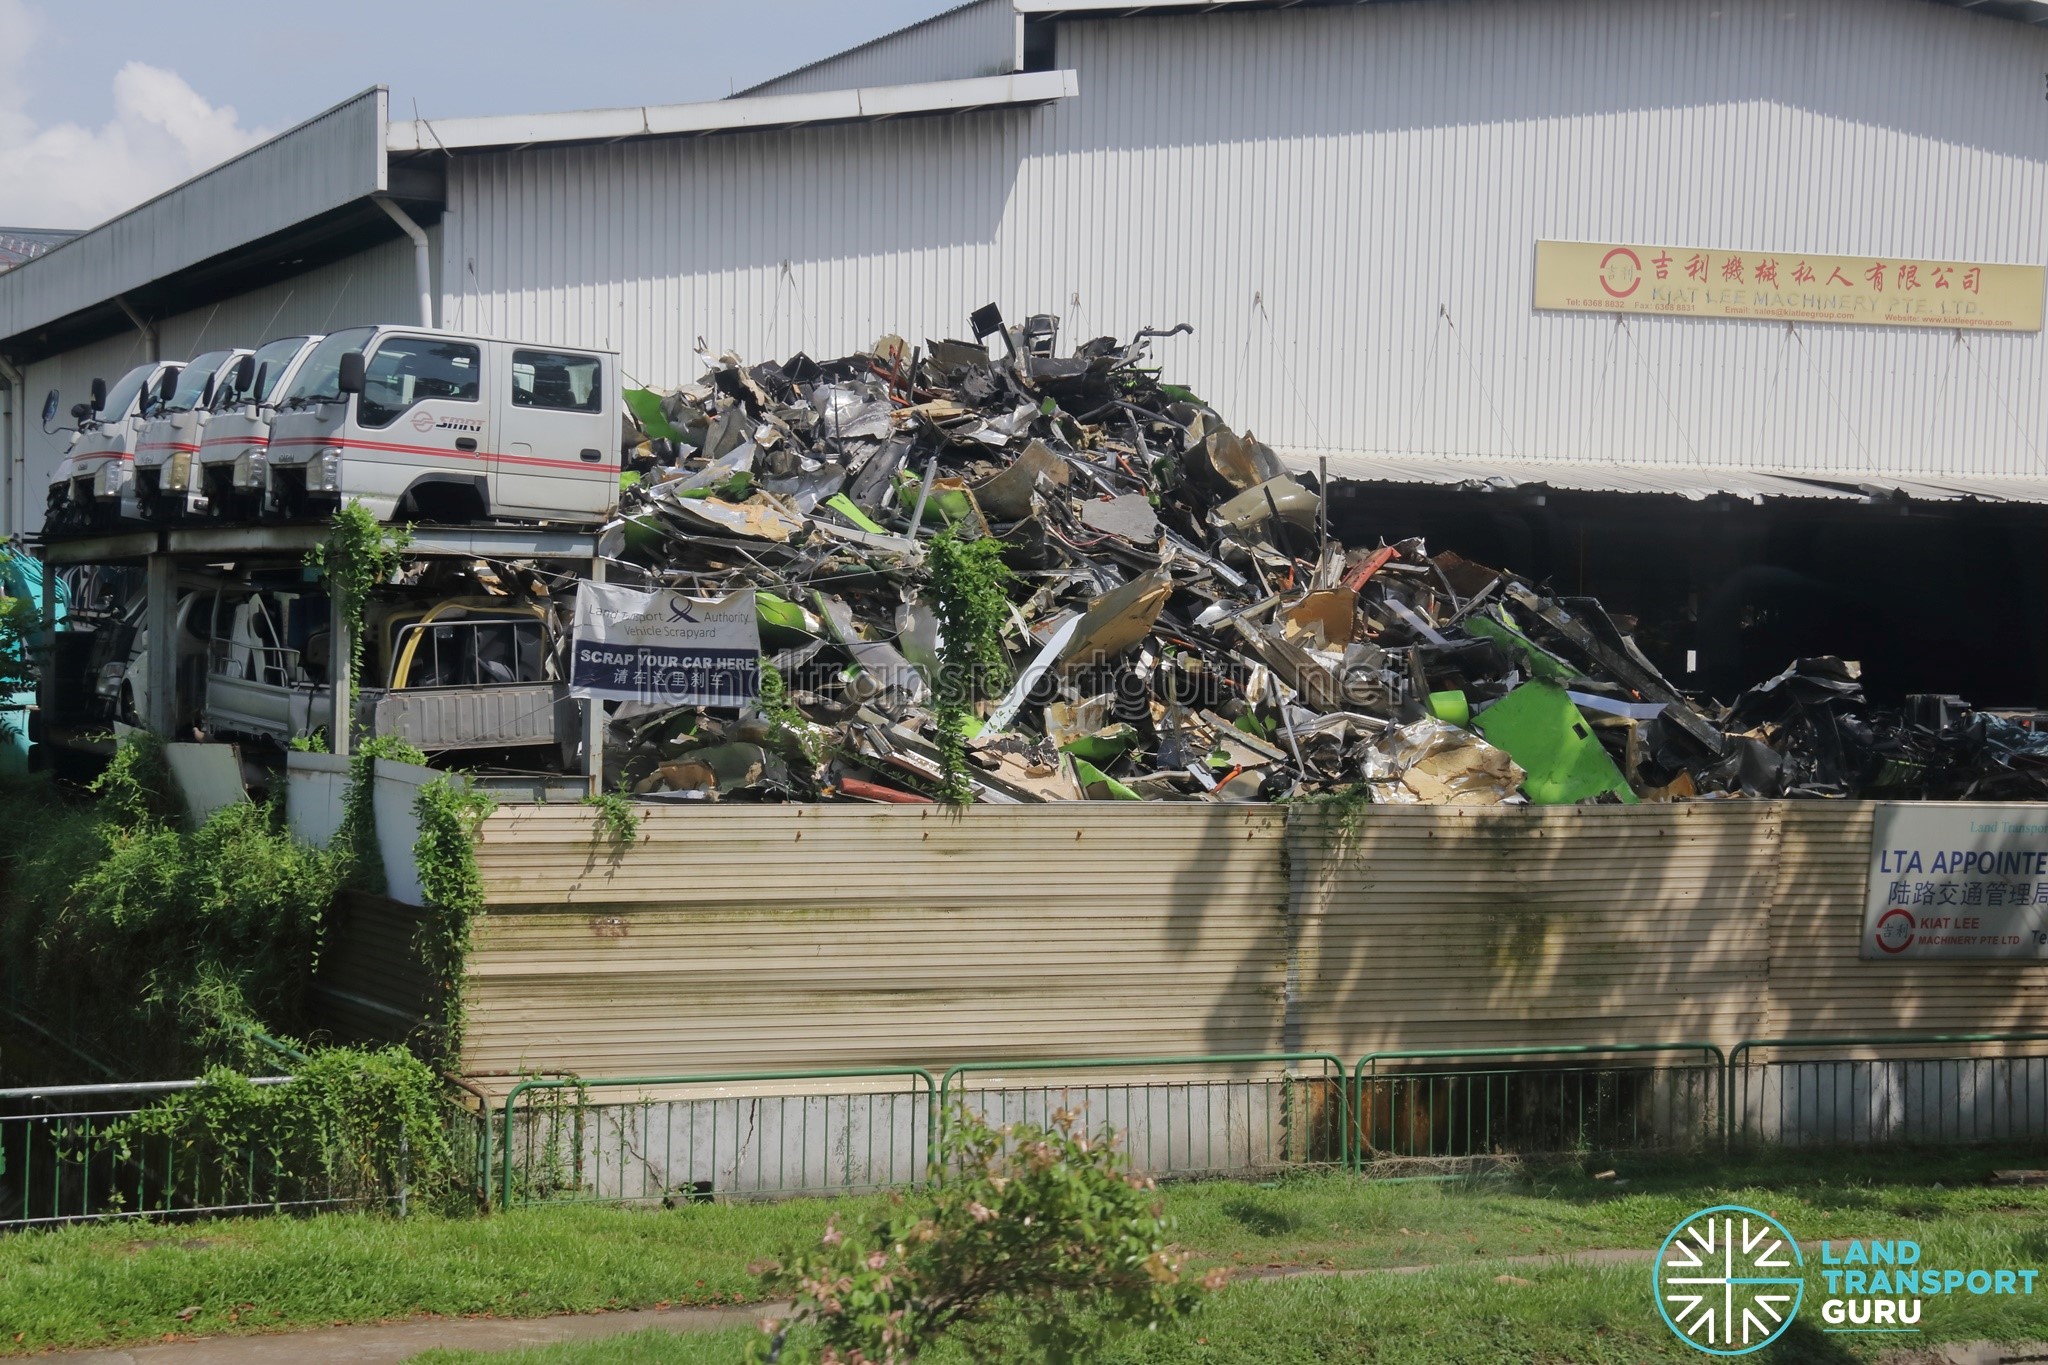

More recently, LTA has also used lifespan management in the opposite direction to maintain network capacity.
From 2025, it began extending Mercedes-Benz OC500LE and Scania K230UB buses beyond their 17-year statutory lifespan rather than retiring them on schedule. This was likely done to preserve operational headroom as the Bus Connectivity Enhancement Programme (BCEP) rolls out network expansions. Keeping these buses in service provides fleet flexibility while the industry awaits new electric bus deliveries.
As the sole buyer of public buses, LTA can coordinate large-scale technology trials across all four public transport operators, such as rolling out buses across the fleet. Its first meaningful electric bus order — the 2018 tender for 60 buses under Contract PT323 — was deliberately split between overnight depot charging and pantograph fast-charging at bus interchanges. This allowed LTA to compare both technologies in revenue service before committing to either at scale.
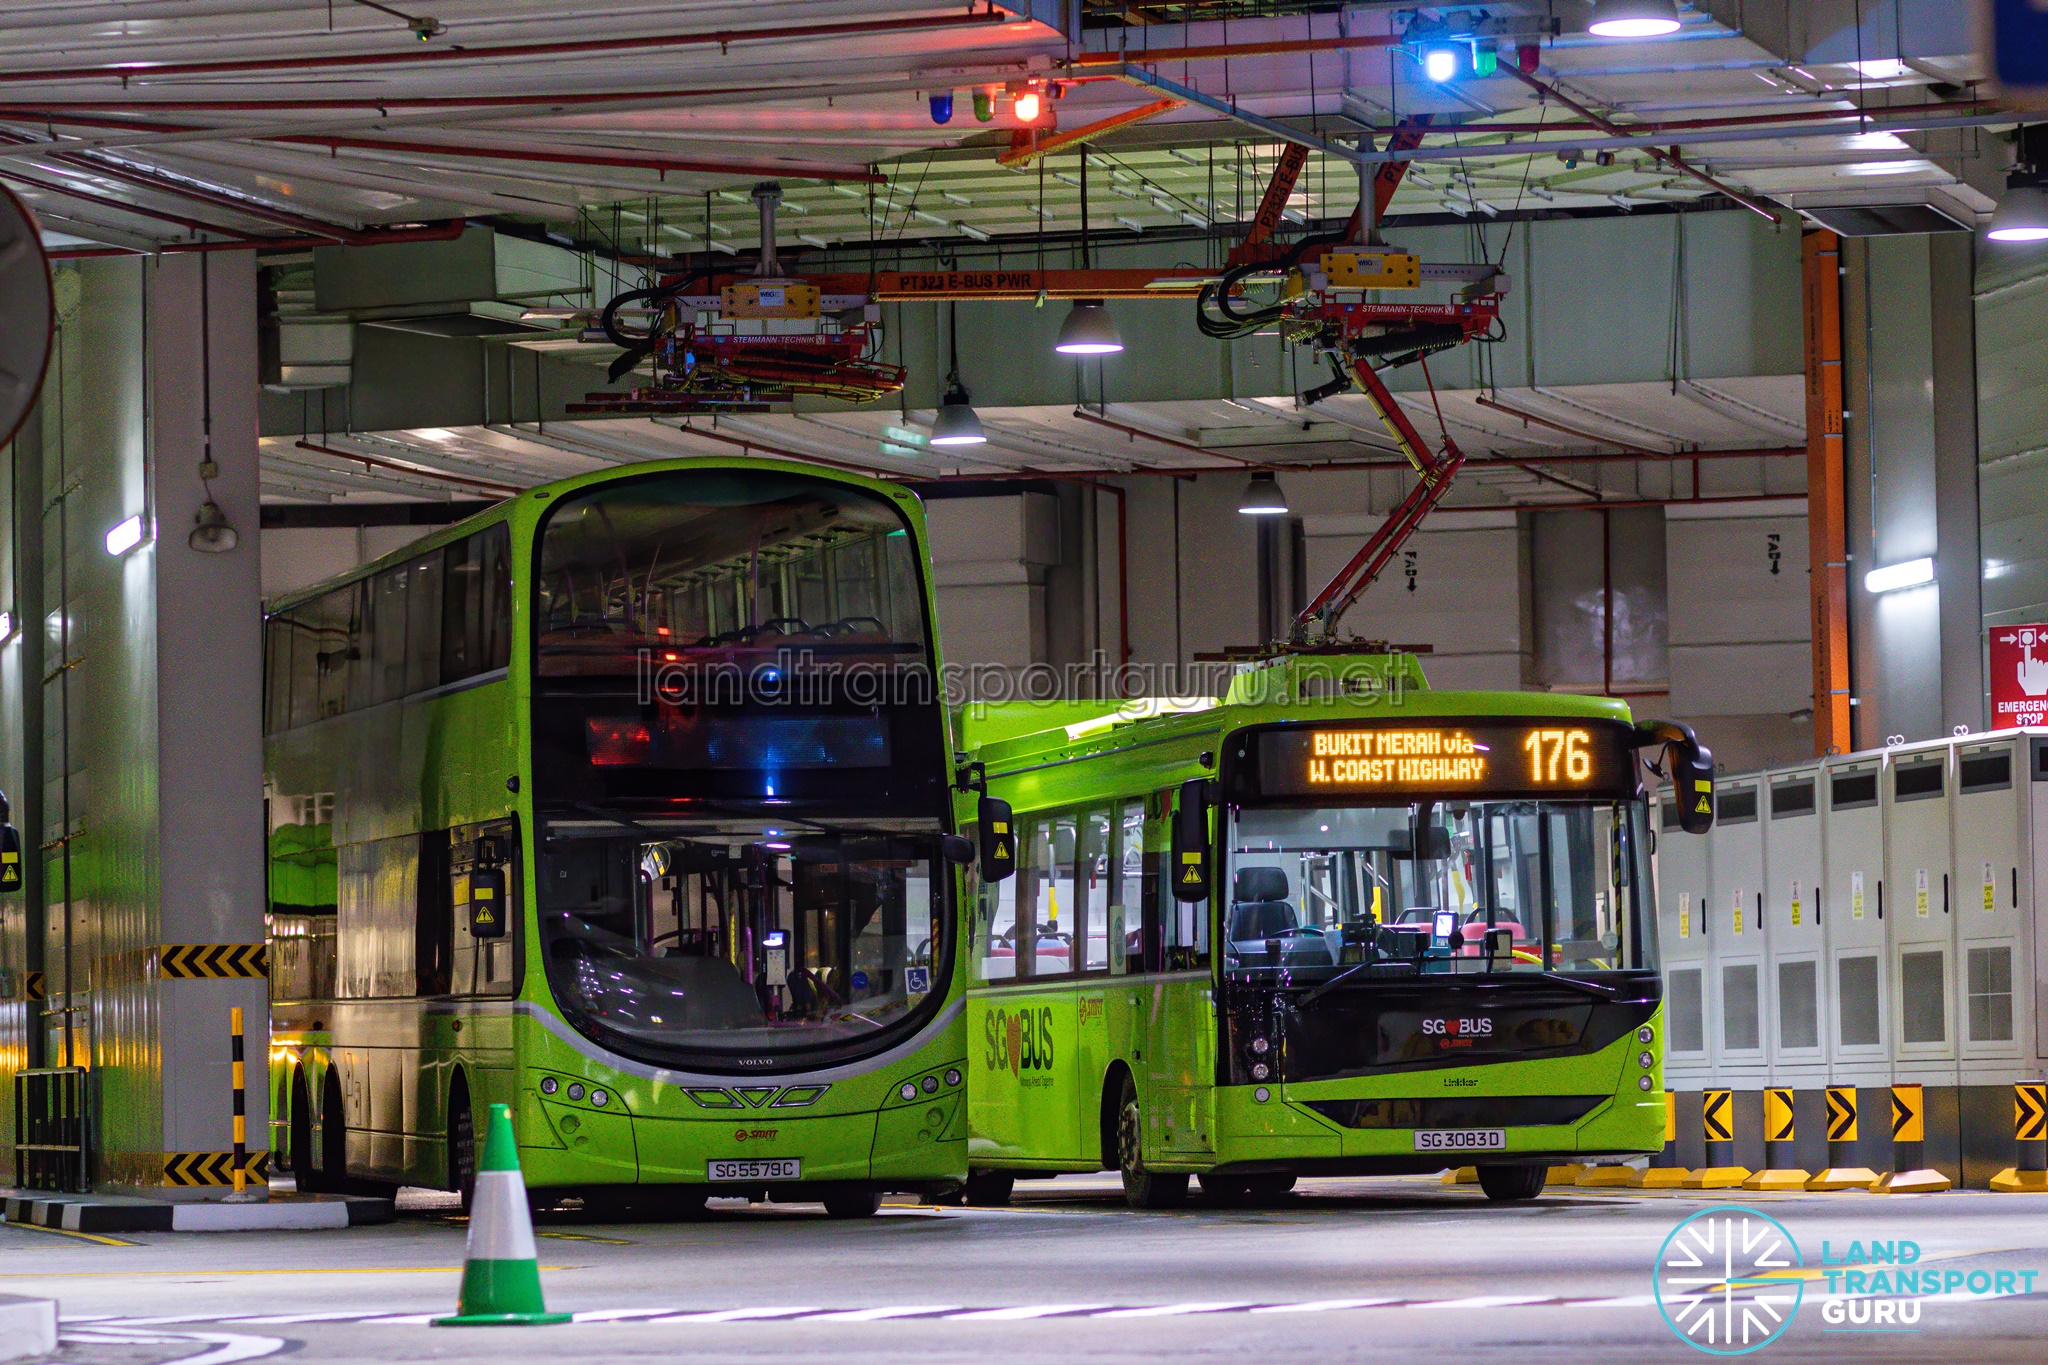
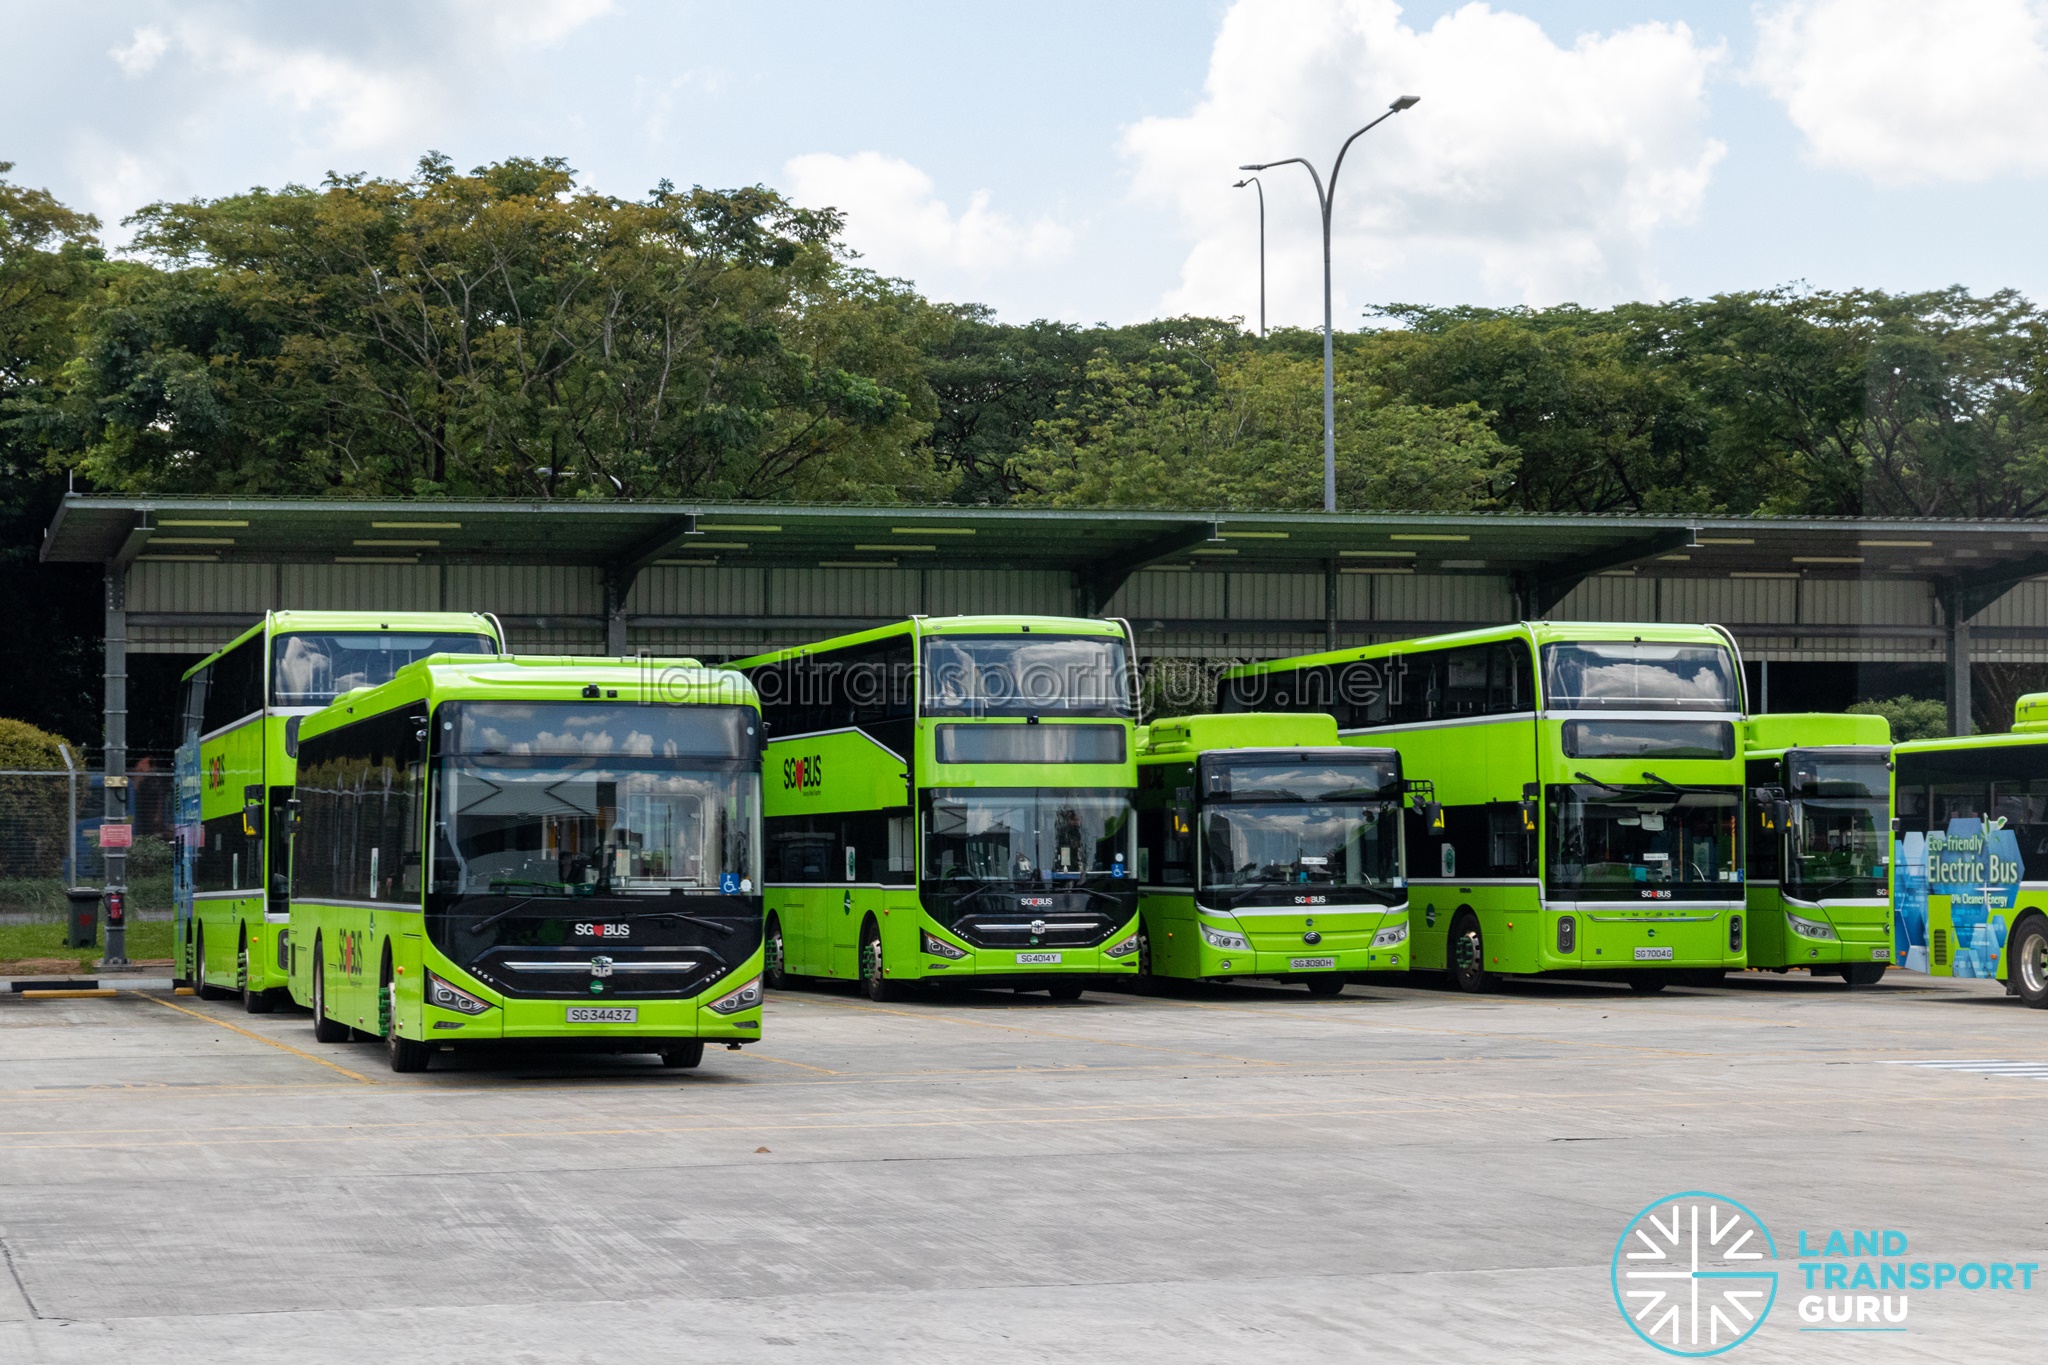

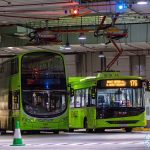
Charging infrastructure has rapidly expanded since then. Early small-scale installations under Contract PT323 at the Seletar, Bulim and Loyang bus depots, alongside pantograph chargers at Bukit Panjang and Bedok bus interchanges, have been succeeded by large-scale installations under Contracts BD401 and BD405, expanding cable charging to additional depots and bus interchanges. This signals a long-term transition toward a hybrid depot-and-interchange cable charging model.
A contestable market — in theory, less so in practice
BCM broke up the old two-operator structure. Singapore now has four major operators — SBS Transit, SMRT Buses, Tower Transit Singapore and Go-Ahead Singapore — operating 14 bus packages.
The 2016 entry of Tower Transit and Go-Ahead proved BCM could draw new operators into a previously concentrated market. More significantly, competition has since extended to incumbents contesting each other’s territory: Tower Transit took over the Sembawang–Yishun Bus Package from SMRT Buses in 2021; Go-Ahead won the Tampines Bus Package in 2025; and SMRT Buses is set to take over Serangoon–Eunos Bus Package from SBS Transit in 2027. An operator can now lose a substantial slice of its network to a rival, which means every incumbent has to run its current contracts well while competing for the next one.
But the strongest evidence against BCM’s competitive claims is a simple number: bidder counts have collapsed since the earliest rounds. Bulim, Loyang and Seletar — the first three tendered packages — drew 11, 10 and 9 bidders respectively. Recent tenders have drawn a fraction of that interest, and where overseas operators still bid, they have priced themselves out rather than undercut incumbents:
| Tender | Package | Contract start | Unique bidders | Bid spread (low–high) | Awarded operator | Was Winner the lowest bidder? |
|---|---|---|---|---|---|---|
| PT200 | Bulim | 2016 | 11 | 63.8% | Tower Transit | No (4th-lowest) |
| PT201 | Loyang | 2016 | 10 | 26.9% | Go-Ahead | Yes |
| PT202 | Seletar | 2018 | 9 | 21.5% | SBS Transit | Yes |
| PT203 | Bukit Merah | 2018 | 6 | 23.8% | SBS Transit | No (4th-lowest) |
| PT217A | Bulim (2nd term) | 2021 | 5 | 22.1% | Tower Transit | No (2nd-lowest) |
| PT217B | Sembawang–Yishun | 2021 | 5 | 22.7% | Tower Transit | No (2nd-lowest) |
| PT218A | Bukit Merah (2nd term) | 2024 | 6 | 25.7% | SBS Transit | Yes |
| PT218B | Jurong West | 2024 | 6 | 30.3% | SMRT Buses | Yes |
| PT219 | Seletar (2nd term) | 2025 | 5 | 17.7% | SBS Transit | No (2nd-lowest) |
| PT220 | Tampines | 2026 | 5 | 11.1% | Go-Ahead | No (Highest bidder) |
| BC802 | Serangoon–Eunos | 2027 | 3 | 7.5% | SMRT Buses | Yes |
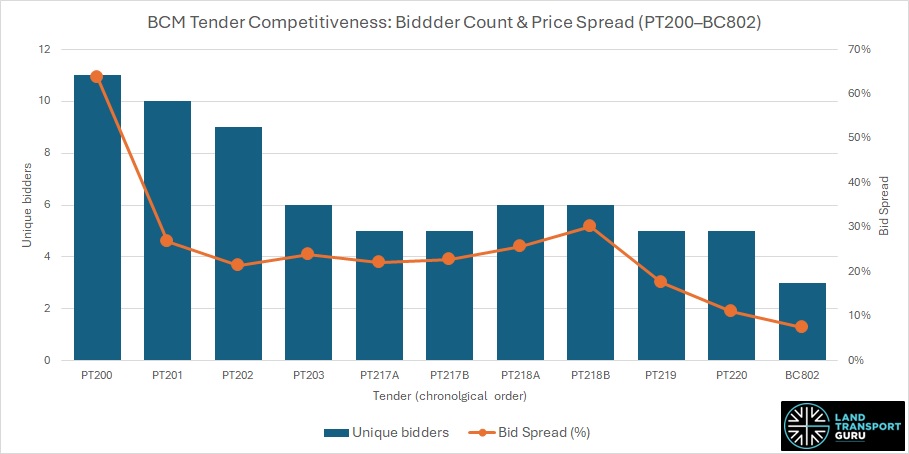
Data from the past 11 public bus tenders show a clear decline in market participation. Tender participation has plateaued in the 5 to 6 bidder range throughout most of the 2020s, with the latest Serangoon–Eunos tender dropping to an all-time low of just 3 bidders.
Alongside falling bidder counts, the price spread between the highest and lowest published bids has narrowed significantly. Setting aside figures from the first BCM tendered contract in Bulim, the price variance decreased from approximately 27% at the Loyang tender down to 7.5% at the Serangoon–Eunos tender. This convergence indicates that surviving bidders share increasingly similar cost structures, a hallmark of a maturing market, though it also reflects the narrower statistical range inherent to fewer participants.
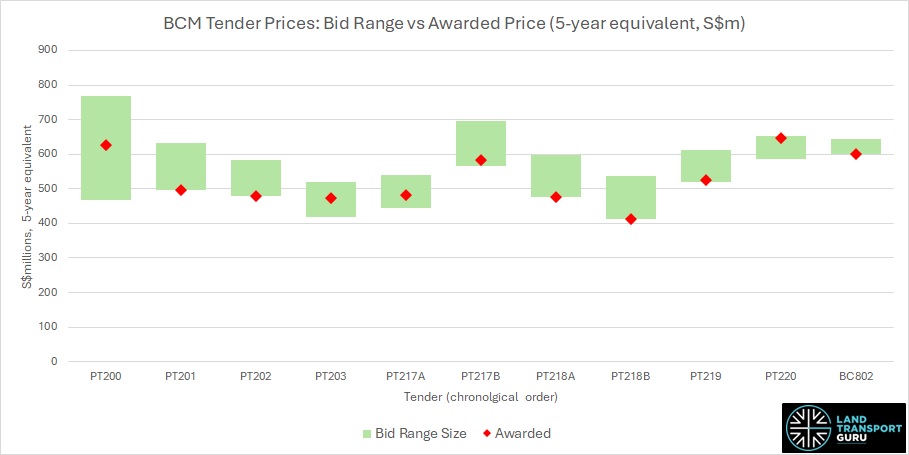
A common misconception is that the lowest bid automatically wins an LTA contract. In reality, the lowest bidder won only 5 out of the last 11 tenders. In the remaining 6 instances—including the inaugural PT200 tender—LTA selected an operator with a higher price point. The most notable example is Go-Ahead’s Tampines (PT220) win, where the contract was awarded to the most expensive bidder at a premium of 11.1% (equivalent to S$50 million over 5 years) above the lowest bid by SBS Transit.
This pattern demonstrates that LTA’s two-envelope quality-and-price evaluation operates exactly as designed, preventing price ranking alone from dictating outcomes. Consequently, a declining bidder count does not automatically equate to a drop in actual qualitative competition. It also means the overseas bidders who did participate and lost — Transdev, National Express, Bravo Transport, Nex Continental among them — cannot be assumed to have lost purely on price, though without published quality scores, there is no way to confirm what actually separated them from the winner.
Local and Overseas Operators Exit
The stringent requirements of the framework have led several previously shortlisted overseas and local private players to cease bidding entirely. Australia’s Busways Group, France’s RATP Dev Asia, and Keolis did not participate in the Bukit Merah tender despite being shortlisted for earlier packages. Woodlands Transport, one of Singapore’s largest private bus operators, hasn’t bid beyond the first three rounds.
Foreign operators that continued bidding have generally priced themselves out rather than undercutting local incumbents:
- Contract PT218: Transdev bid S$597.5m on Bukit Merah and S$518.6m on Jurong West, higher than all four local incumbents on both counts. National Express bid S$563.0m and S$536.1m, higher than three of the four. The winning bids were S$476.5m and S$411.5m respectively, awarded to SBS Transit and SMRT Buses.
- Contract PT219: Hong Kong’s Bravo Transport (owner of Citybus) bid S$612m; Spain/Portugal’s Nex Continental Holdings bid S$559m, both above SBS Transit’s winning S$526m.
The thinning isn’t limited to overseas exits, either: Go-Ahead Singapore, one of BCM’s four established operators, sat out two of three most recent tenders on record — PT219 (Seletar, 2025) and BC802 (Serangoon–Eunos, 2027) — leaving BC802 contested by the three remaining local incumbents, without an overseas challenger. That an established local operator is now selectively skipping tenders is a further sign the pool is narrowing from the inside, not just losing overseas interest from the outside.
Structural Barriers to Entry
Structurally, BCM tenders are fiercely price-competitive, leaving thin margins for hopeful newcomers without existing scale. Incumbents already have trained staff, depots and local operational knowledge baked into their cost base. For a new entrant, the five-year firm contract period leaves limited time to recoup startup costs before having to re-tender, even with the introduction of 2-to-5-year option extensions in later contracts. Crucially, a new entrant bears the full downside risk of establishing local operations, with no guarantee of securing a follow-on contract.
As a result, a market that appeared highly contestable on paper in 2016 has steadily consolidated around the four established incumbents.
“Competition For the Market” vs “In the Market”
The BCM is structured around competition for the market, not competition in the market. For instance, a commuter in Bukit Batok does not choose between Tower Transit and Go-Ahead for the same route — operators compete periodically for the right to run it, and the winner then operates as a regulated monopoly for the contract term.
Because consumers cannot switch providers if service quality degrades, accountability depends entirely on LTA’s performance monitoring, contractual penalties, and renewal incentives. This structure places a high premium on the quality and transparency of contract management, and leads us to our next point:
The Performance Transparency Gap
This is a key gap in BCM’s implementation: LTA has not been forthcoming about comparative operator performance. While MRT rail reliability reports have been published since 2016 (now published monthly, as of October 2025), there is no equivalent regular public reporting for bus operators. In contrast, global benchmarks like Transport for London publish per-route performance data covering the past 12 months for public inspection.
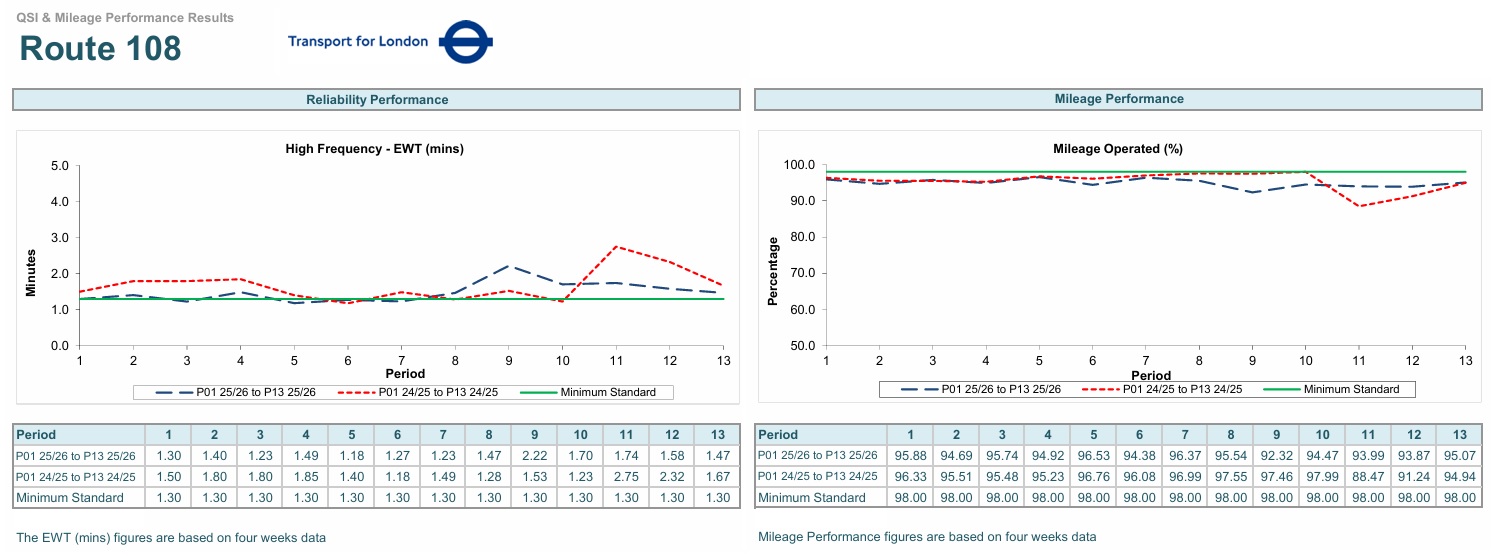
LTA actively tracks operators against internal key performance indicators (KPIs), including Excess Wait Time, On-Time Adherence and scheduled mileage. However, these granular, operator-by-operator metrics are not regularly published in a consolidated public format.
While the Ministry of Transport (MOT) has selectively disclosed aggregate EWT and OTA compliance data in response to Parliamentary Questions, these remain ad-hoc disclosures. This transparency gap was highlighted in Louis Chua’s adjournment motion on public transport reform in August 2026, though the official response did not commit to publishing comparative operator performance data. Without regular, comparable data, commuters and researchers have no straightforward way to see how SBS Transit, SMRT Buses, Tower Transit and Go-Ahead actually perform against one another over time.
Incentive and Penalty Opacity
The financial dynamics of the BCM incentive structure also remain opaque. LTA disclosures show that total annual incentive payments to bus operators rose from close to S$20 million in 2017 [Link] to S$27 million by 2023 [Link].
Despite these substantial public disbursements, LTA does not publish a consistent per-operator breakdown of financial rewards. Because the exact methodology, performance thresholds, and individual operator outcomes are withheld, independent observers cannot fully evaluate if financial payouts align tightly with service quality improvements.
Ten years in, tendering itself has been slower than promised
At its 2016 launch, the BCM divided Singapore’s public bus network into 14 geographic route packages of approximately 300 to 500 buses each. Only a handful went to open tender immediately; the rest were retained under the incumbents as Negotiated Contracts running two to ten years, with tendering meant to follow progressively.
A decade after implementation, only 8 of the 14 packages have undergone competitive open tendering. The most recent package to transition was Serangoon–Eunos, which will transfer to SMRT Buses in 2027. The remaining six packages continue to be operated by incumbents under negotiated contracts.
The depot-readiness theory doesn’t hold up
LTA’s tendering schedule has traditionally appeared linked to infrastructure readiness. The prevailing theory suggests that a route package is only opened for tender once a new, purpose-built bus depot is ready to support it. Prior to completion, the incumbent operator is retained to bridge the operational gap.
Seven of the eight tendered packages conform to this model, operating out of newly commissioned LTA depots. The sole exception is Jurong West, where LTA bypassed construction by purchasing the existing Soon Lee Bus Depot directly from SBS Transit.
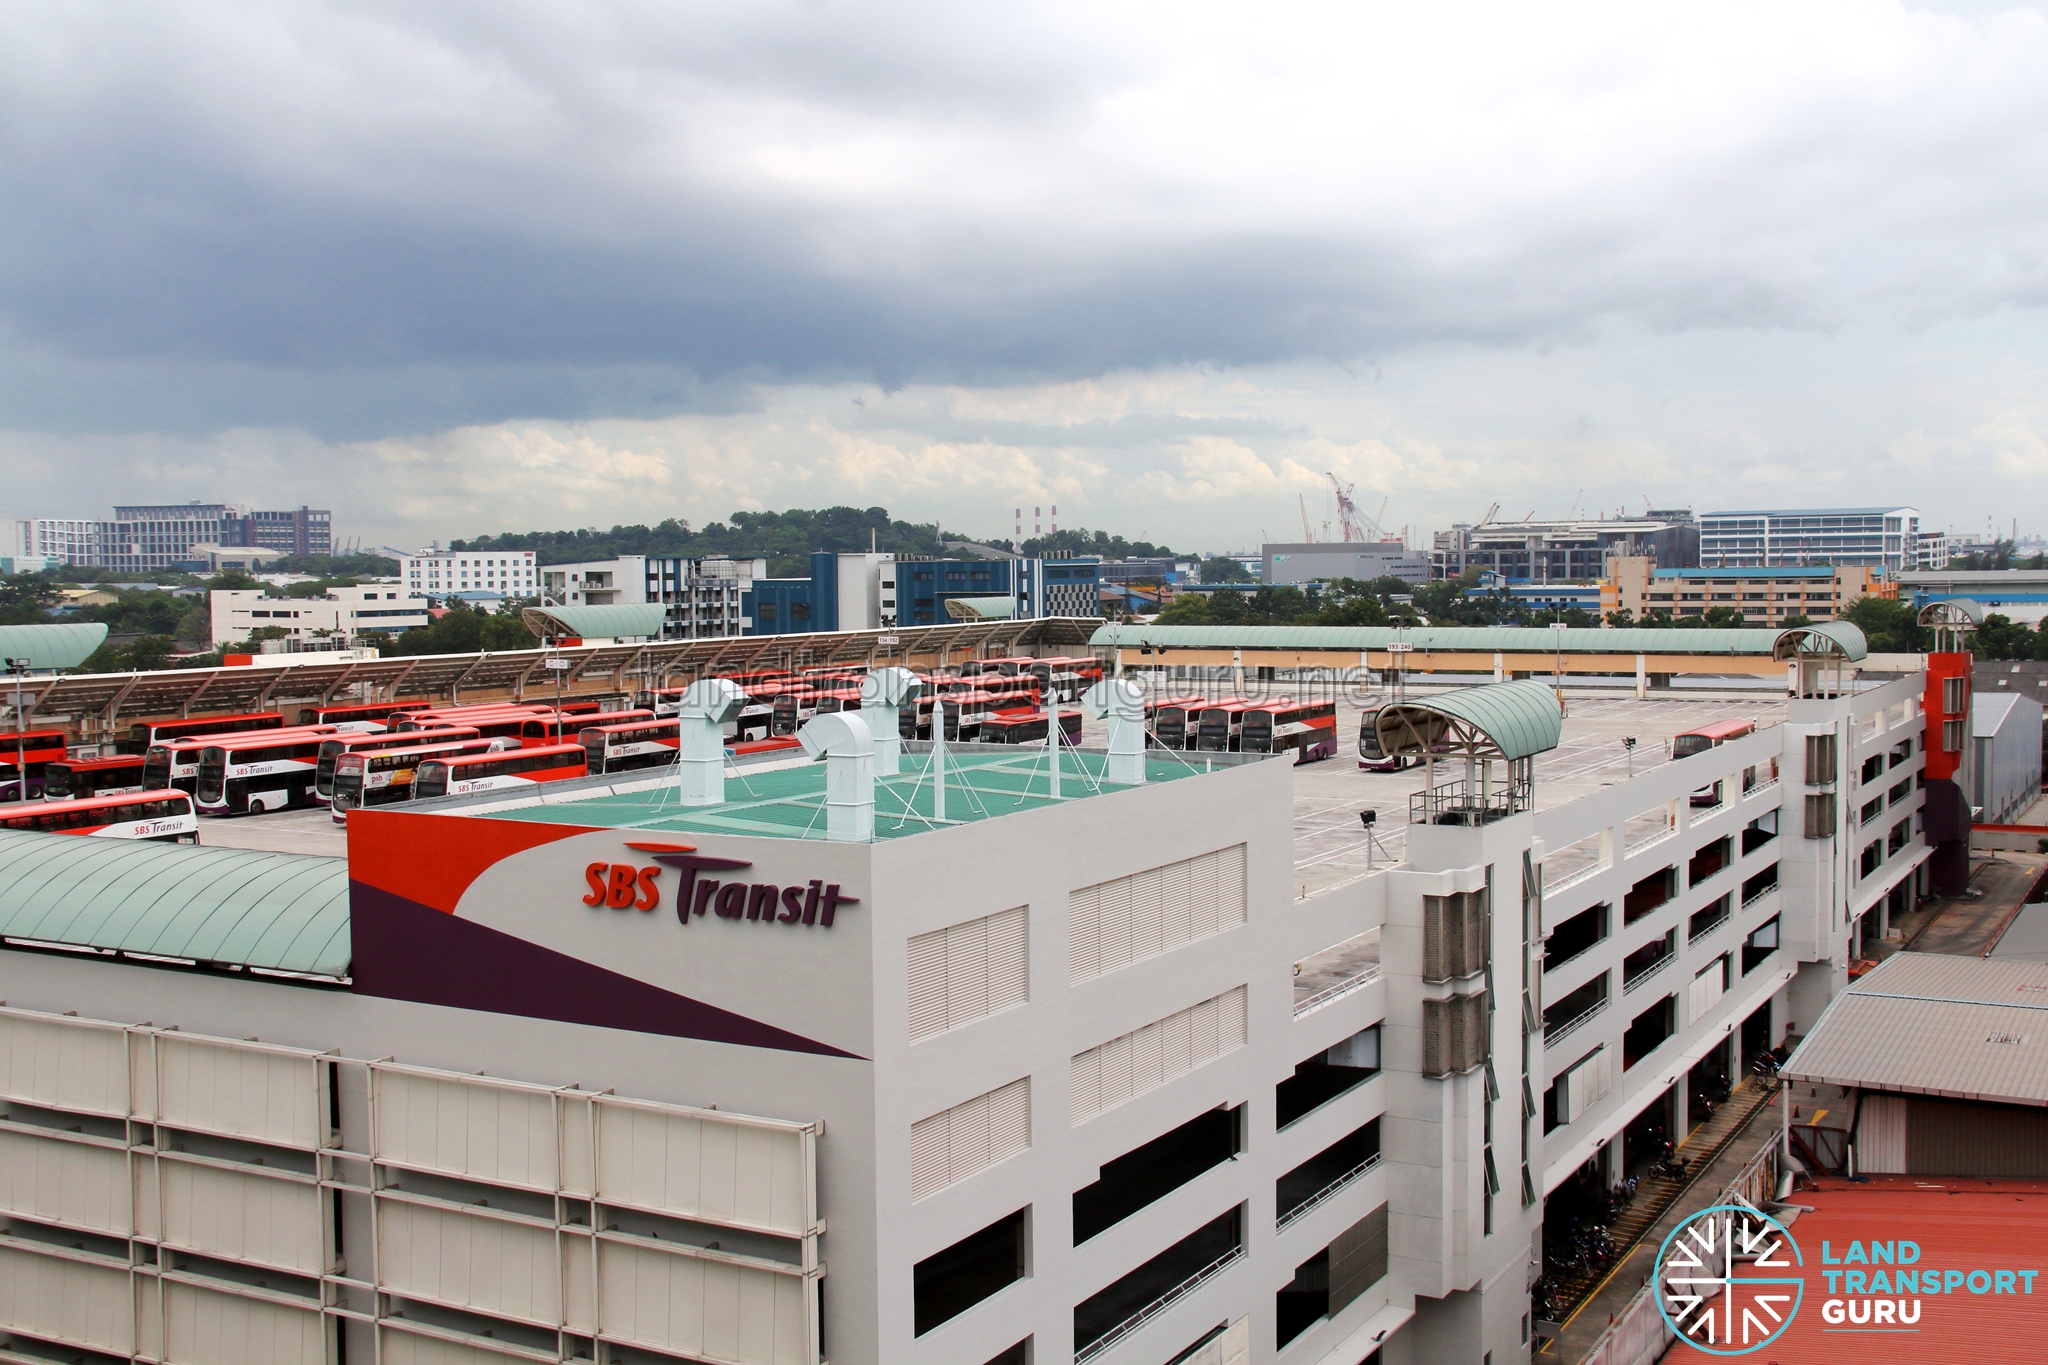
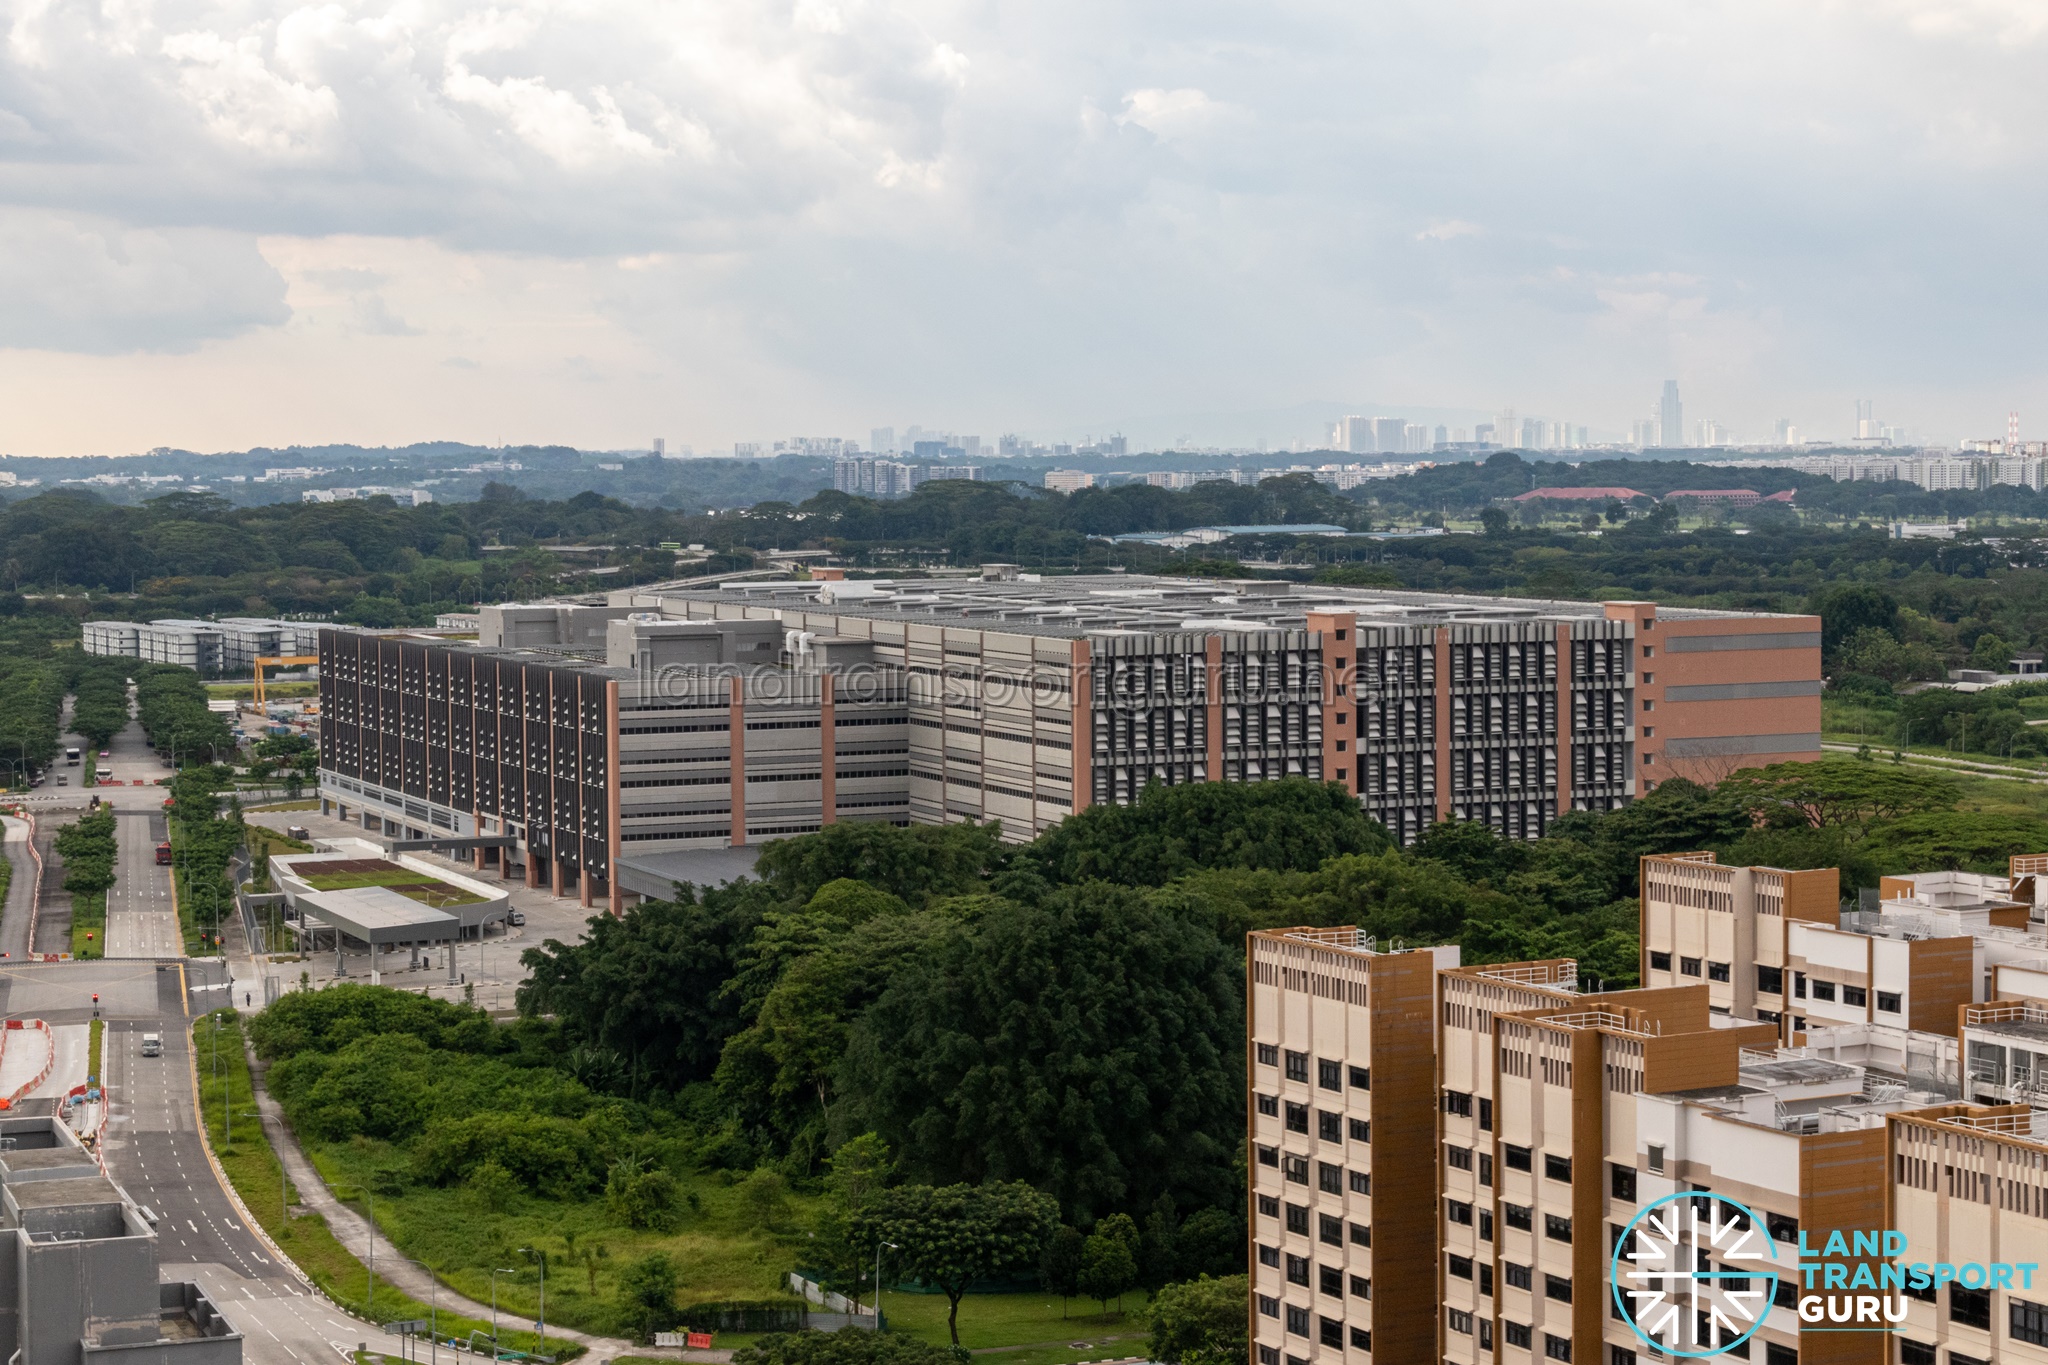

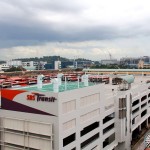
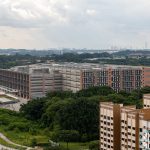
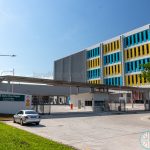
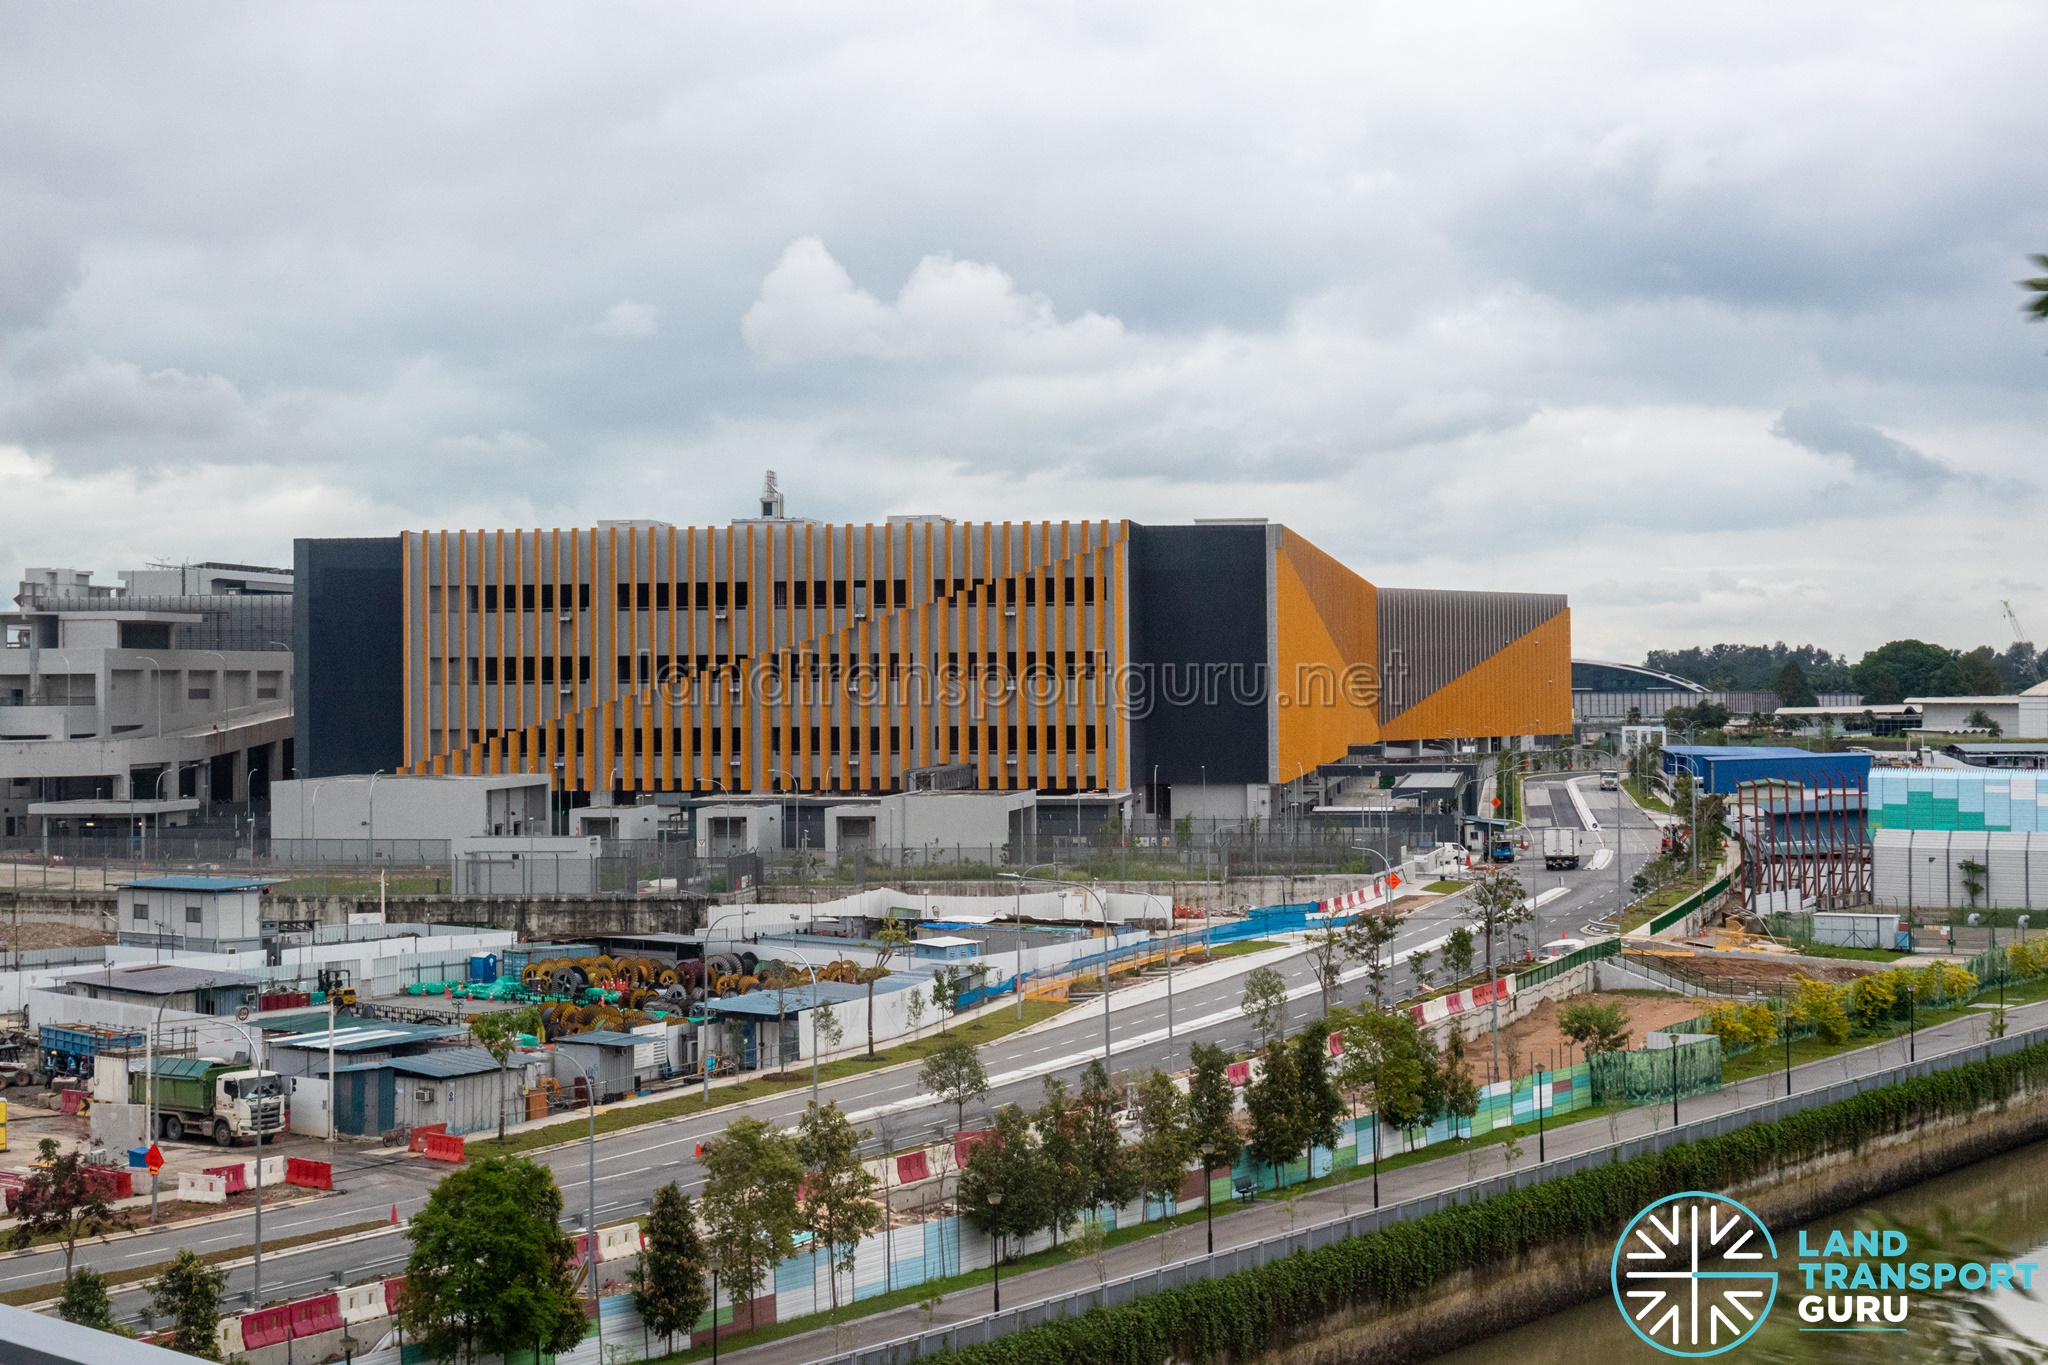
However, recent infrastructure developments challenge this depot-readiness explanation: new depots at Sengkang West and Gali Batu have both opened without triggering a tender for the packages they now support. SMRT had gone one step further by investing $6 million into a new Intelligent Operations Control Centre at Gali Batu that opened in 2026, signalling some form of confidence in its ability to retain Gali Batu in the medium- to long-term.
This indicates that depot readiness is an incomplete explanation for the pace of tendering. Instead, the slow pace of tendering is likely influenced by unstated factors, such as operational caution, financial considerations, or a strategic preference for incumbent stability—though LTA has never stated it outright.
Opacity in Contract Extensions
BCM packages are awarded for a standard five-year term. Contracts issued before 2023 allowed for a two-year extension based on performance, while contracts awarded from 2023 onward expanded the potential extension window to between two and five years.
While extending a contract minimises operational disruption and avoids the high administrative costs of re-tendering, a five-year extension can effectively lock in a ten-year operator relationship. This long-term continuity reduces competitive pressure, limits opportunities for new market entrants, and restricts LTA’s ability to benchmark performance.
LTA has also been notably quiet about when and why extensions happen, for both Negotiated and Tendered contracts. In December 2024, an LTA spokesperson told The Straits Times that, when deciding between a contract extension and a competitive tender, LTA considers factors including prevailing market conditions and the impact on operations. However, LTA did not disclose how these factors are weighed or what thresholds trigger an extension.
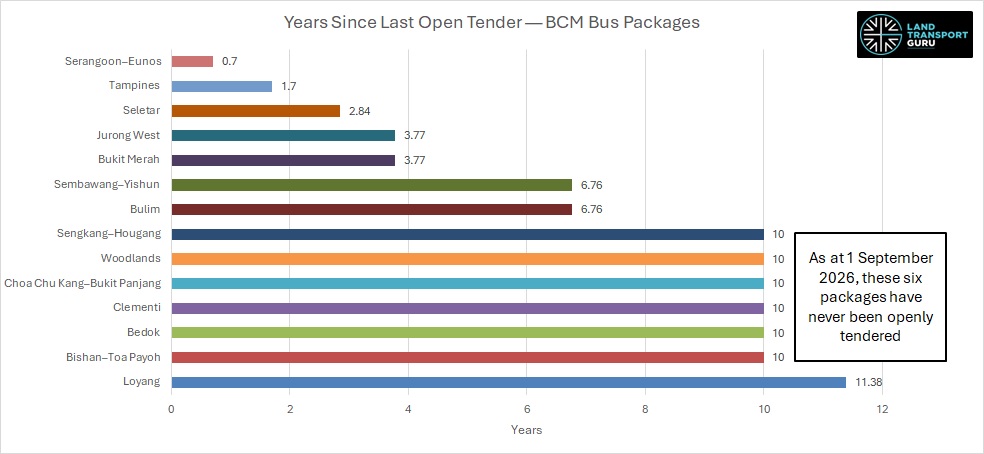
On disclosures known to the public, the 2023 extension of the Woodlands and Choa Chu Kang–Bukit Panjang packages by three years, for example, only became public via a Straits Times media query rather than an official announcement. The clearest disclosed instance came via a different channel entirely: when the Downtown Line moved to the New Rail Financing Framework v2 in January 2022, LTA simultaneously negotiated extensions for five bus packages (Bedok, Tampines, Serangoon–Eunos, Clementi, and Bishan–Toa Payoh) at revised, lower rates, as part of the broader rail fare-risk-sharing deal.
There are reasonable grounds for extending an incumbent. Competitive tendering is expensive and time-consuming; transition costs and risks from switching operators are real, and extending a stable, well-performing operator at a renegotiated (often lower) rate may be more pragmatic than running another tender. The problem is not that LTA extends contracts; it is that the criteria for doing so are not sufficiently transparent for outsiders to assess whether an extension reflects sound operational judgement or simply the path of least resistance.
That matters against LTA’s own 2016 framing of a full transition to competitive contracting. A decade on, six packages remain on indefinite extension with no firm tendering date in sight, while Loyang’s first competitively-tendered term has been similarly extended indefinitely since its start on 4 September 2016. The issue is therefore not simply the length of individual extensions, but whether the extension mechanism is allowing competitive pressure to weaken over time. LTA has identified factors such as prevailing market conditions and operational impact as considerations when deciding between an extension and a competitive tender. The issue is less the absence of stated reasons than the lack of transparency around how these factors are weighed in individual decisions. Without greater visibility on the basis for each extension and when extended packages will return to competitive tender, it remains difficult for the public to assess whether the extension mechanism is preserving the contestability that BCM was originally intended to create.
Compounding Incumbency Advantages: Depot access and shared overhead costs
The BCM structure creates systemic advantages for incumbent operators, allowing them to consistently out-bid external challengers through two distinct operational mechanisms: depot access and shared overhead.
Depot Access
Although public bus routes frequently cross package boundaries or span the island, the BCM organises the network into rigidly bounded geographic packages with buses operating out of a single depot, creating operational friction regarding fleet deployment and depot allocation. This presents an underlying paradox: the Government owns a nationally mobile fleet, but the contractual structure can leave that fleet operationally less mobile than central ownership was meant to enable.
Incumbents with multiple depots can bypass this friction to lower their operating costs. For instance, during the 2018 Bukit Merah package tender, SBS Transit secured the package via an “alternative bid” of S$472 million, which came in S$3 million below its own base proposal. It achieved this by garaging select Bukit Merah services (such as Service 57 and 198) in its existing Ang Mo Kio and Soon Lee depots, cutting down on dead mileage. Likewise, it cross-garaged non-Bukit Merah package Services 95 and 201 out of Ulu Pandan Depot.
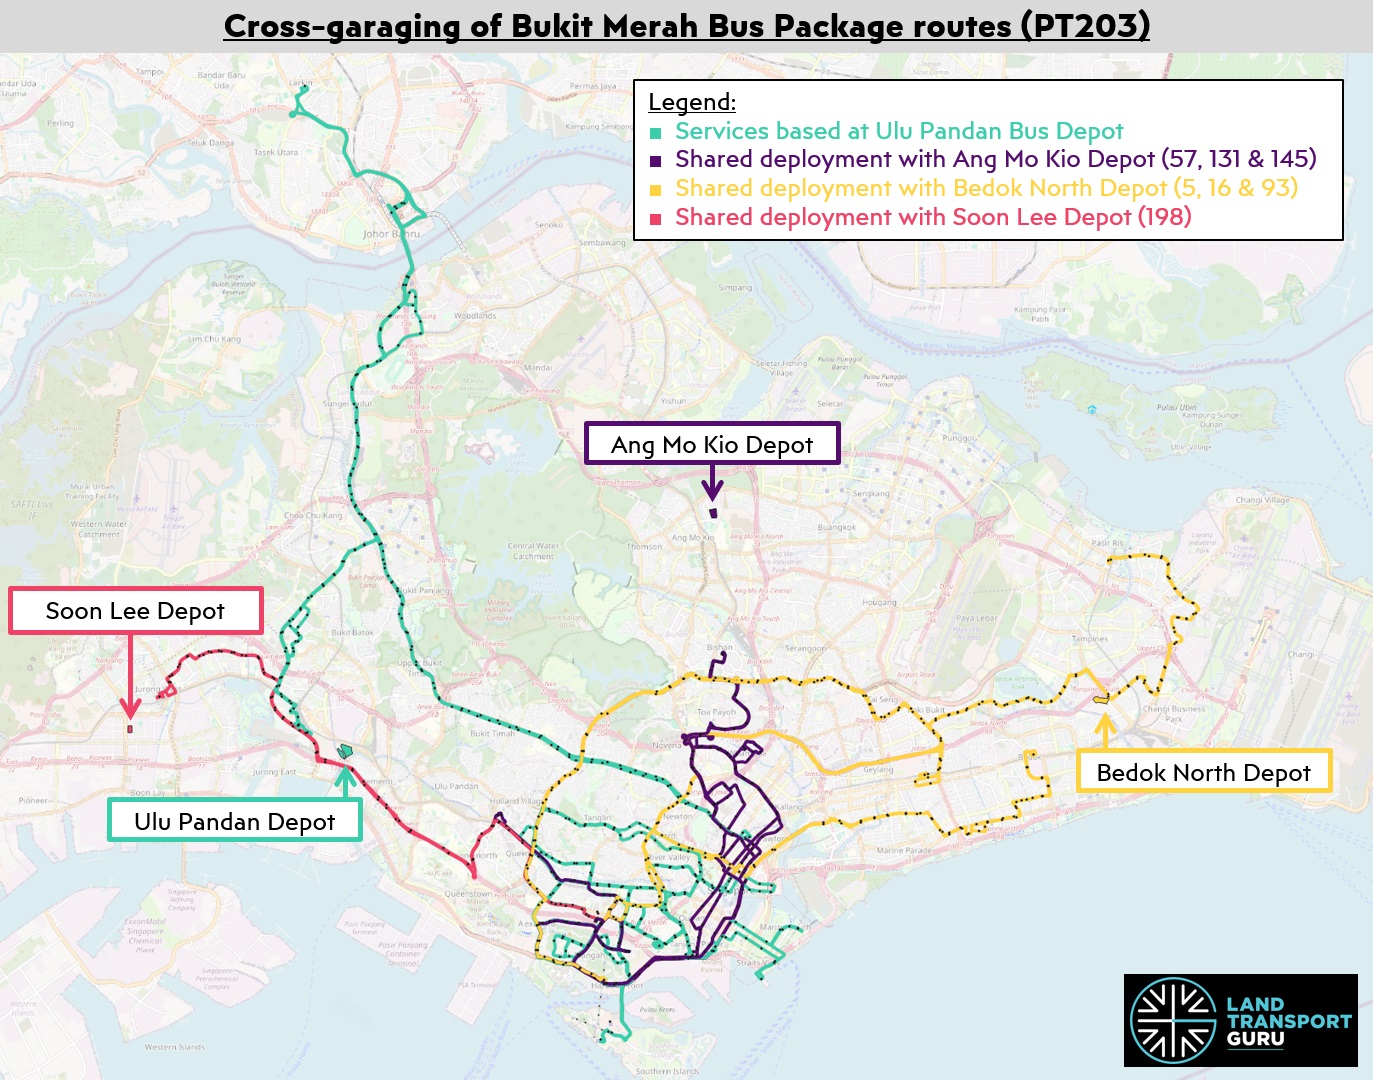
SBS Transit repeated this strategy during the 2023 re-tender, submitting an alternative bid of S$476 million against its S$491 million base proposal, successfully undercutting SMRT Buses’ next-lowest bid of S$496 million. This dual-depot arrangement demonstrates real savings — albeit specific to how SBS Transit happens to operate, and not a universal feature of every incumbent win.
PT217/PT218 Price Comparisons (Combined package tenders)
Bidding price data from PT217 and PT218, where two bus packages were tendered together, makes it possible to measure the combined effect directly:
| Bidder | Combined base bid (S$m) | Sum of separate base bids (S$m) | Saving (S$) | Saving (%) |
| PT217 (Bulim + Sembawang–Yishun) | ||||
| SMRT Buses | $1,189.6m | $1,236.9m | $47.3m | 3.82% |
| Tower Transit (overall winner) | $1,025.1m | $1,064.5m | $39.4m | 3.70% |
| Go-Ahead | $1,057.7m | $1,069.0m | $11.4m | 1.06% |
| SBS Transit | $1,008.8m | $1,016.2m | $7.3m | 0.72% |
| PT218 (Bukit Merah + Jurong West) | ||||
| Transdev | $1,075.0m | $1,117.4m | $42.4m | 3.79% |
| National Express | $1,063.8m | $1,099.1m | $35.2m | 3.21% |
| Go-Ahead | $1,051.0m | $1,066.1m | $15.1m | 1.41% |
| Tower Transit | $987m | $987.6m | $0.6m | 0.06% |
| SBS Transit (winner, Bukit Merah) | $919.8m | $921.3m | $1.5m | 0.17% |
| SMRT Buses (winner, Jurong West) | $910.6m | $907.9m | –$2.7m | –0.30% |
Shared Overhead Costs
The advantages of scale are also evident in dual-package tenders, even without physical bus interlining. For example, during the combined Bulim and Sembawang–Yishun tender (Contract PT217), Tower Transit offered a 3.70% cost discount on its combined bid. Because Tower Transit does not cross-garage buses between the Bulim and Mandai depots, these savings stem entirely from shared administrative overhead.
A single corporate infrastructure—encompassing HR, finance, payroll, customer service, safety compliance, and driver recruitment—can support multiple packages simultaneously. While a new entrant must price these fixed setup costs entirely into their first bid, an established incumbent can absorb an additional package at a fraction of the incremental cost, even without cross-garaging buses between both depots.
Interestingly, during the PT218 tender, overseas bidders Transdev and National Express projected the highest combined-bid cost savings at 3.79% and 3.21% respectively — bigger than either eventual winner. In comparison, SBS Transit’s winning combined bid offered just a 0.17% discount, while SMRT Buses submitted a combined bid that was 0.30% more expensive than its separate proposals. In other words, while combined-package bidding may have created some efficiency gains for tenderers in PT218, it still was not enough to overcome gaps in absolute cost base or quality scores.
The 15-minute promise: delivered at peak, quietly eroded off-peak
One of the clearest gaps between BCM’s original pitch and today’s lived experience is the headway promise. At rollout, LTA reported all services meeting a 15-minute-or-better peak standard, with feeders at 6–8 minute intervals, alongside reduced crowding and fleet expansion.
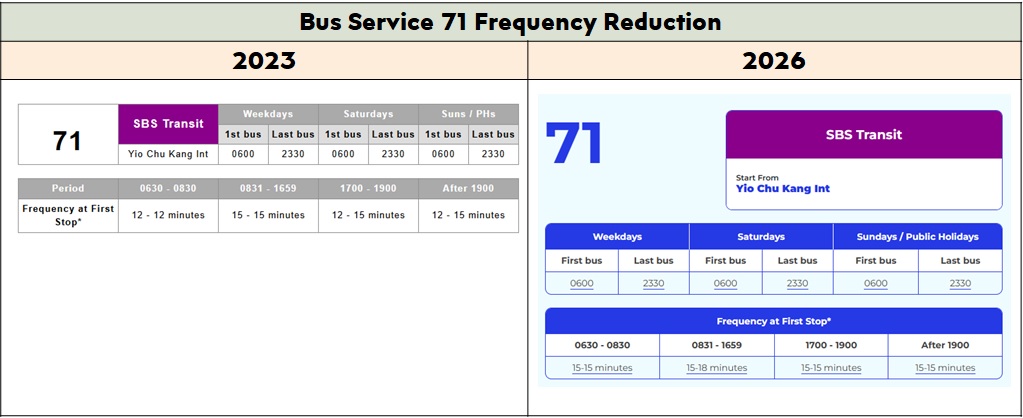
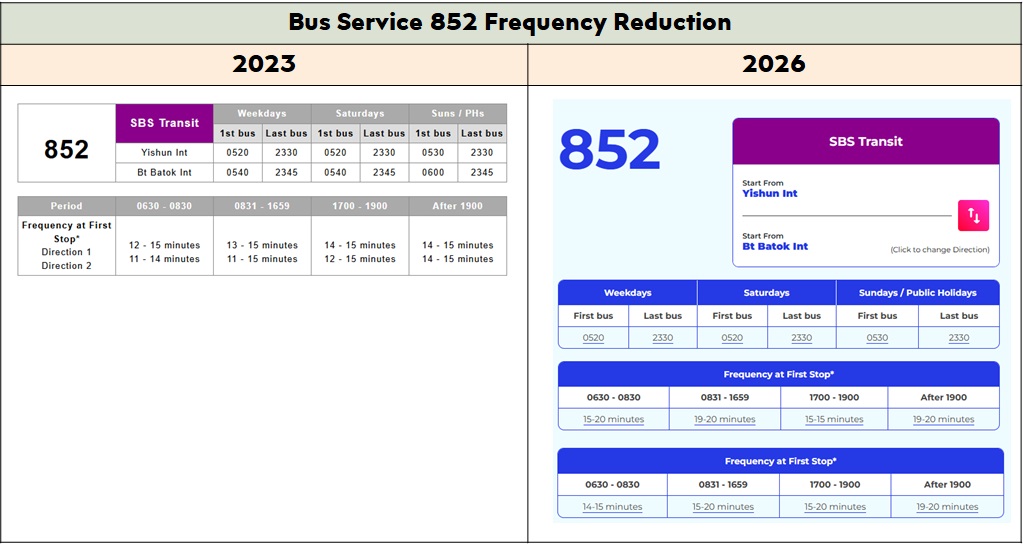
LTA’s current public description of BCM still emphasises peak-period standards and reliability — but a meaningful number of services now run at intervals well beyond 15 minutes outside peak hours. For a commuter who’s just missed a bus, a service running every 20–30 minutes midday doesn’t feel like a “reliable” network, whatever the peak-hour compliance figures say.
Many trunk services — including 5, 21, 59, 85, 86, 124, 125, 162, 174, 852, 853 and 970 — regularly exceed 15 minutes off-peak; a further set, including 14, 56, 62, 83, 93, 122, 132, 166, 175, 183 and 196, exceeds 20 minutes at certain times. The longest-interval services, such as 167, 400 and 883M, run every half hour.
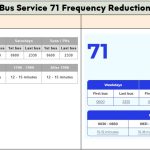
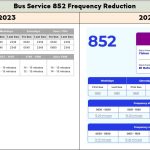
Scheduled headway and actual waiting time also diverge in practice — congestion, bunching and early departures can turn a nominal 15-minute service into a much longer real wait. LTA’s actual enforced standard is 96% of scheduled mileage per service per month, monitored via the EWT/OTA framework, which is a subtly different (and less demanding) bar than “buses every 15 minutes.”
Commuter sentiment reflects the gap: the Public Transport Customer Satisfaction Survey (PTCSS) recorded a 4-point drop in waiting-time satisfaction, from 80% in 2022 to 76% in 2023, which LTA attributed to bus captain manpower shortages affecting operators’ ability to handle disruptions like traffic delays and bad weather — a theme this piece returns to below. In the 2025 PTCSS, crowding and waiting times were the only two categories scoring below 80% satisfaction.
Is BCM necessarily cheaper? The hidden cost of central ownership
Central ownership is one of BCM’s biggest structural achievements: LTA can procure buses at system scale, standardise specifications, and roll out new technology fleet-wide without four separate operators making four separate, uncoordinated fleet decisions. This has mattered enormously for electrification (see below), where treating the fleet as a single national asset rather than four operator fleets makes coordinated infrastructure planning possible at all.
But central ownership doesn’t make the assets free — it simply relocates who carries the cost and risk. Government is now on the hook for bus procurement, depreciation, refurbishment, technological obsolescence, battery and charging infrastructure, and the capital expenditure behind all of it. That is not necessarily a weakness — it can be a genuine advantage if Government uses its scale to procure and manage assets more efficiently than four fragmented operators could.
But it does mean any claim that BCM is “cheaper” can’t be assessed solely by looking at the service fee paid to operators. The real cost picture also lives in system-wide procurement and policy decisions made at LTA — decisions the public rarely sees itemised, and which sit alongside the more than S$2 billion the Government already spends annually subsidising public transport operations. A full accounting of “is BCM cheaper” would need to weigh that capex and depreciation burden against whatever savings centralised procurement scale actually delivers — a comparison LTA hasn’t published in a form the public can check.
Standardised systems — real gains, still mid-rollout
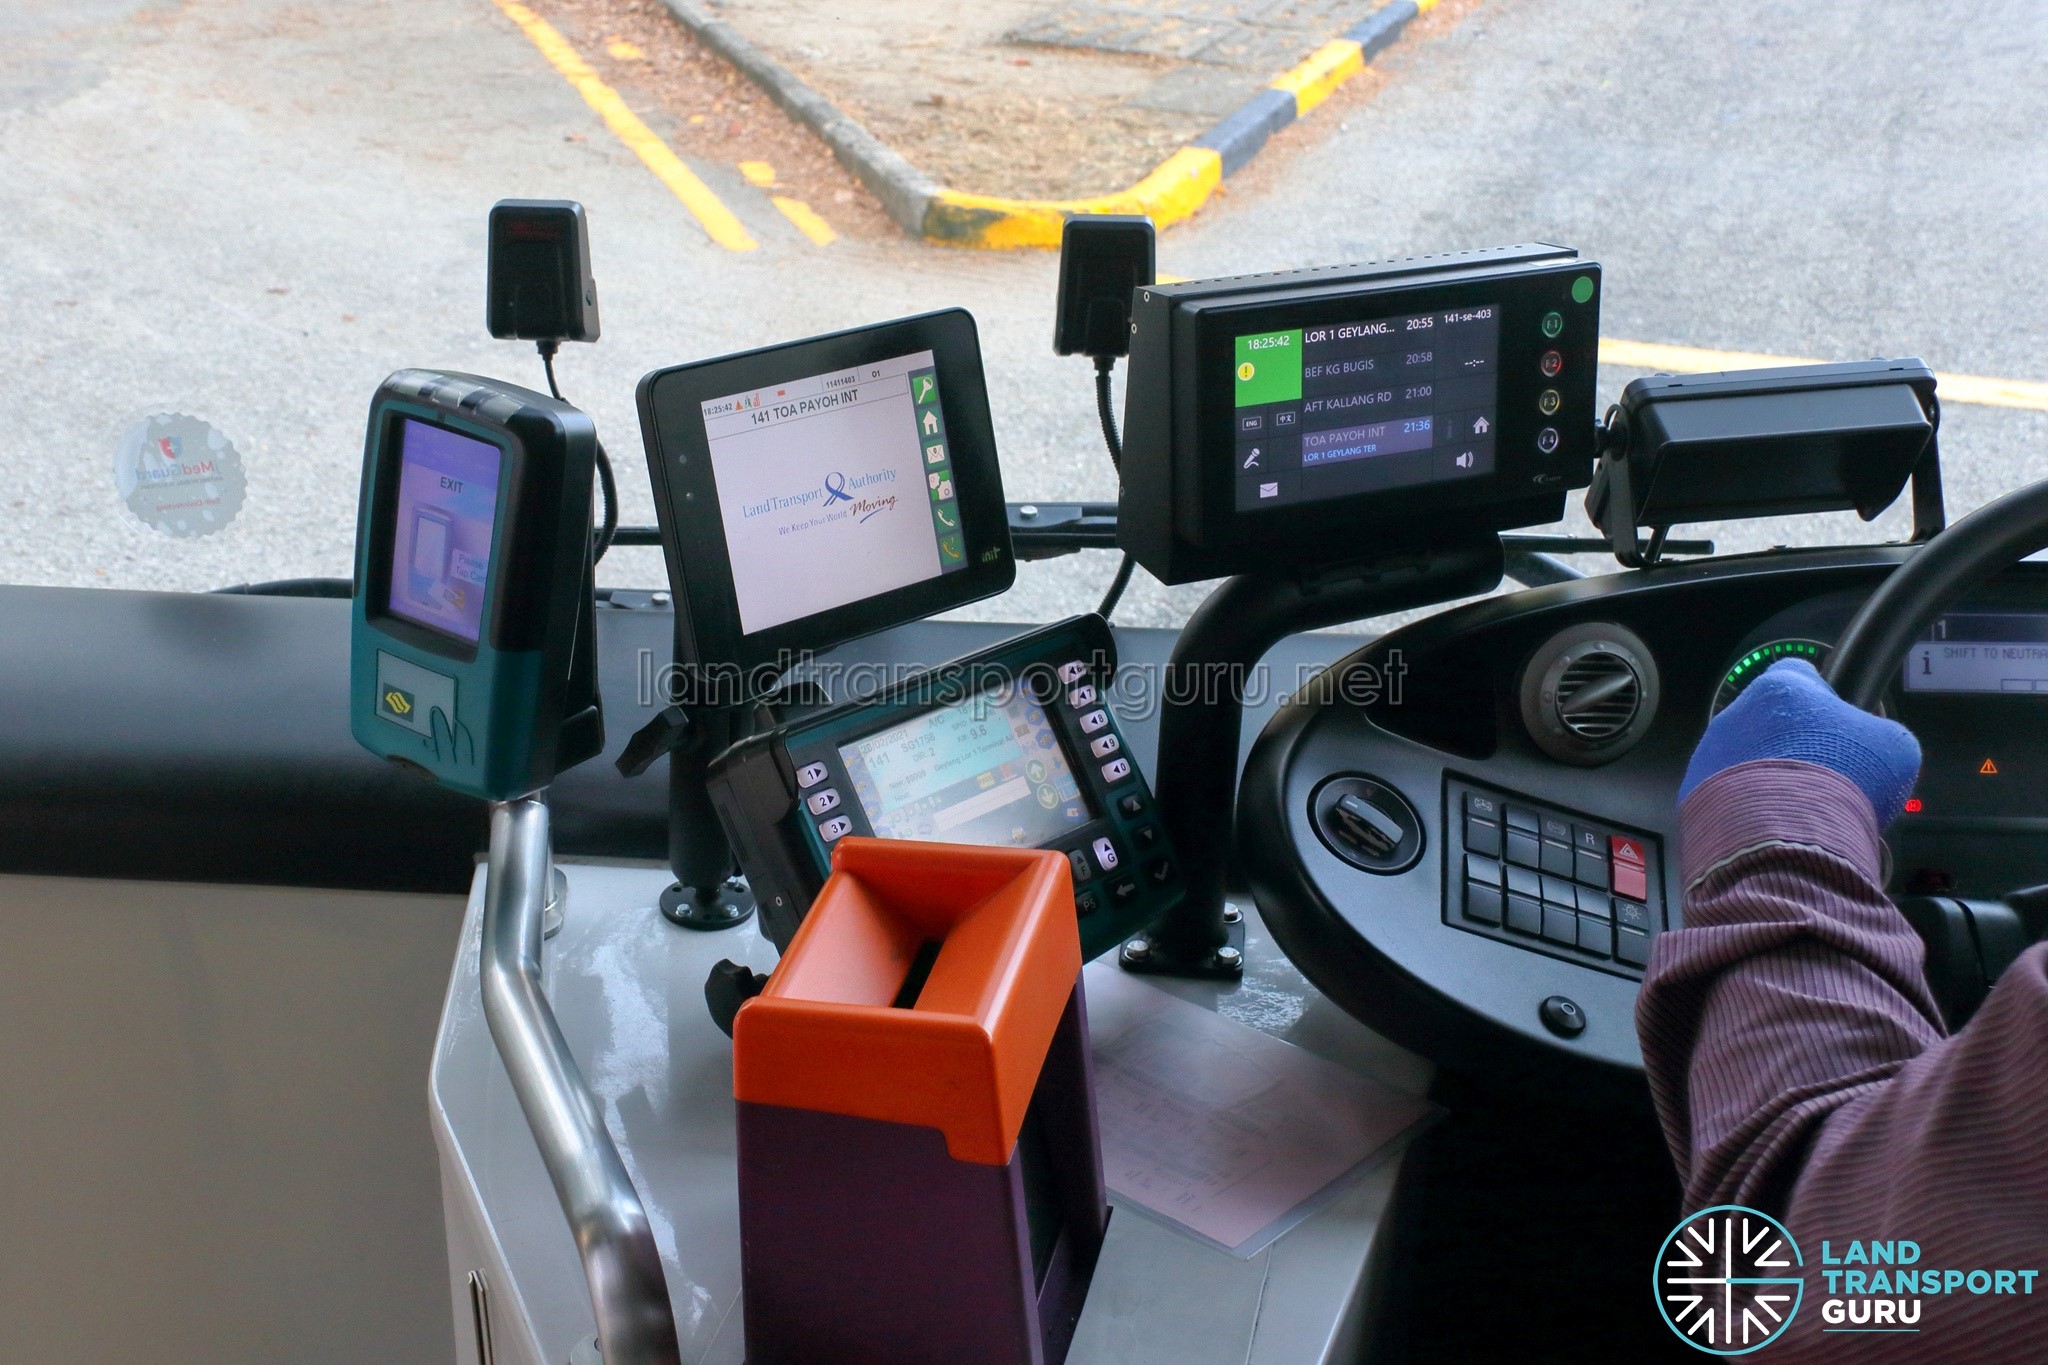
As part of the BCM transition, LTA procured the Trapeze Common Fleet Management System (CFMS), installed fleet-wide between 2016 and 2017 to standardise operations control, fleet management, passenger information and business management across all four operators. A successor system — the Integrated Ticketing and Fleet Management System (ITFS) — is progressively being rolled out and targeted for commissioning by 2027, replacing CFMS while folding the New Onboard Bus Equipment (NOBE) fare system into a single Driver Display Unit and upgrading from NOBE’s current 3G/depot-wireless communication to 5G.

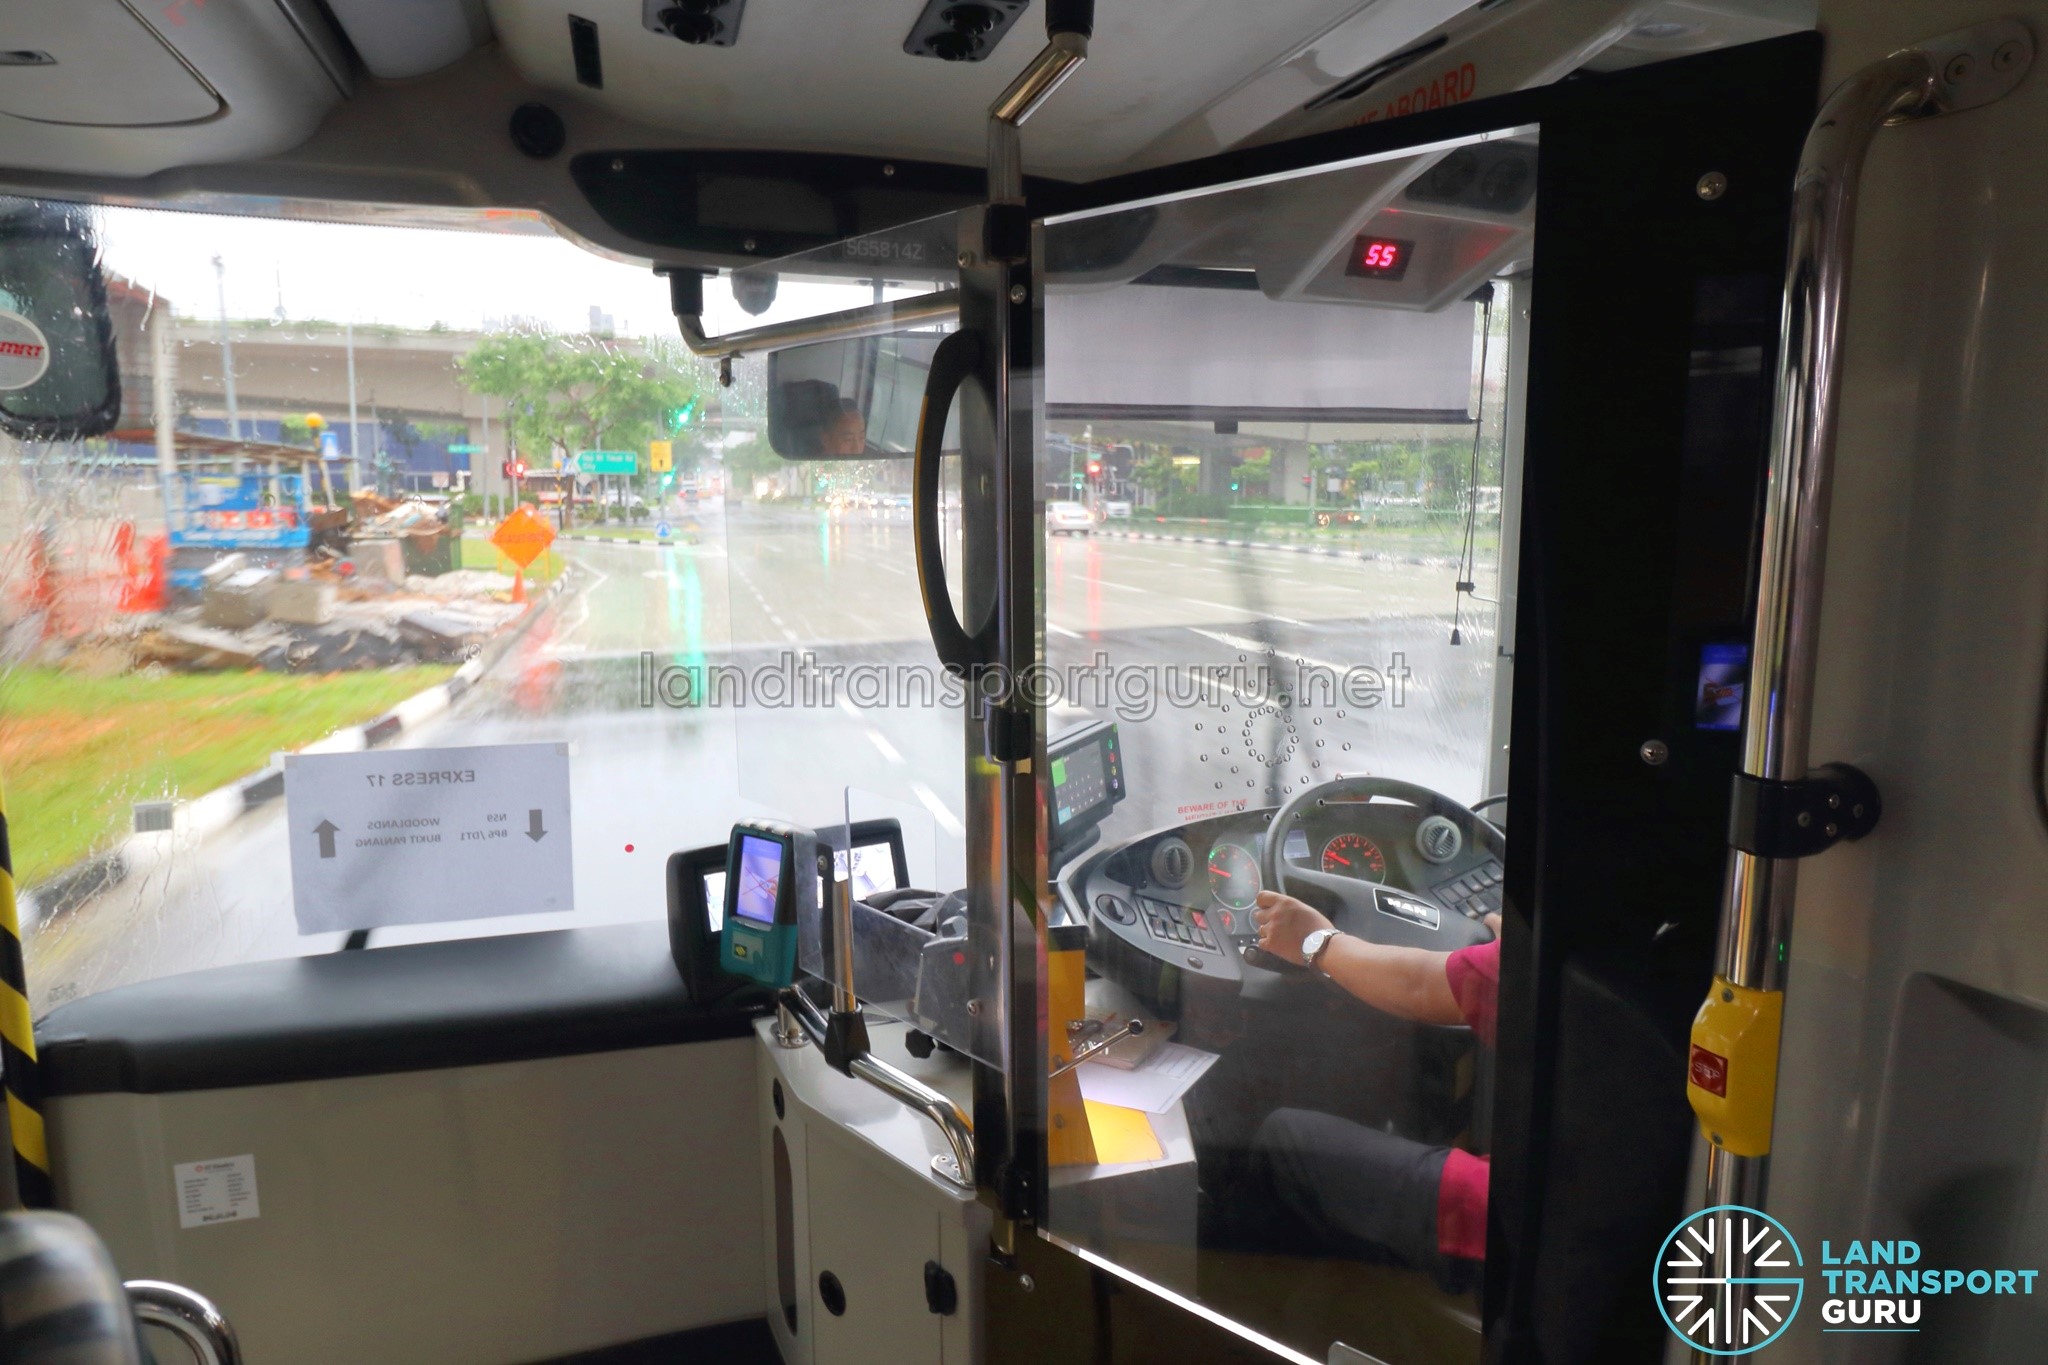
Centralised authority has also let LTA run trials such as:
- Protective Screens for Drivers (six-month trial in 2018)
- Smart Bus Priority System trial (six-month trial in 2018-19)
- Assistive Passenger Information System for commuters with special needs (piloted 2019, expanded 2020)
- Stroller Restraint Systems (rolled out by 2020)
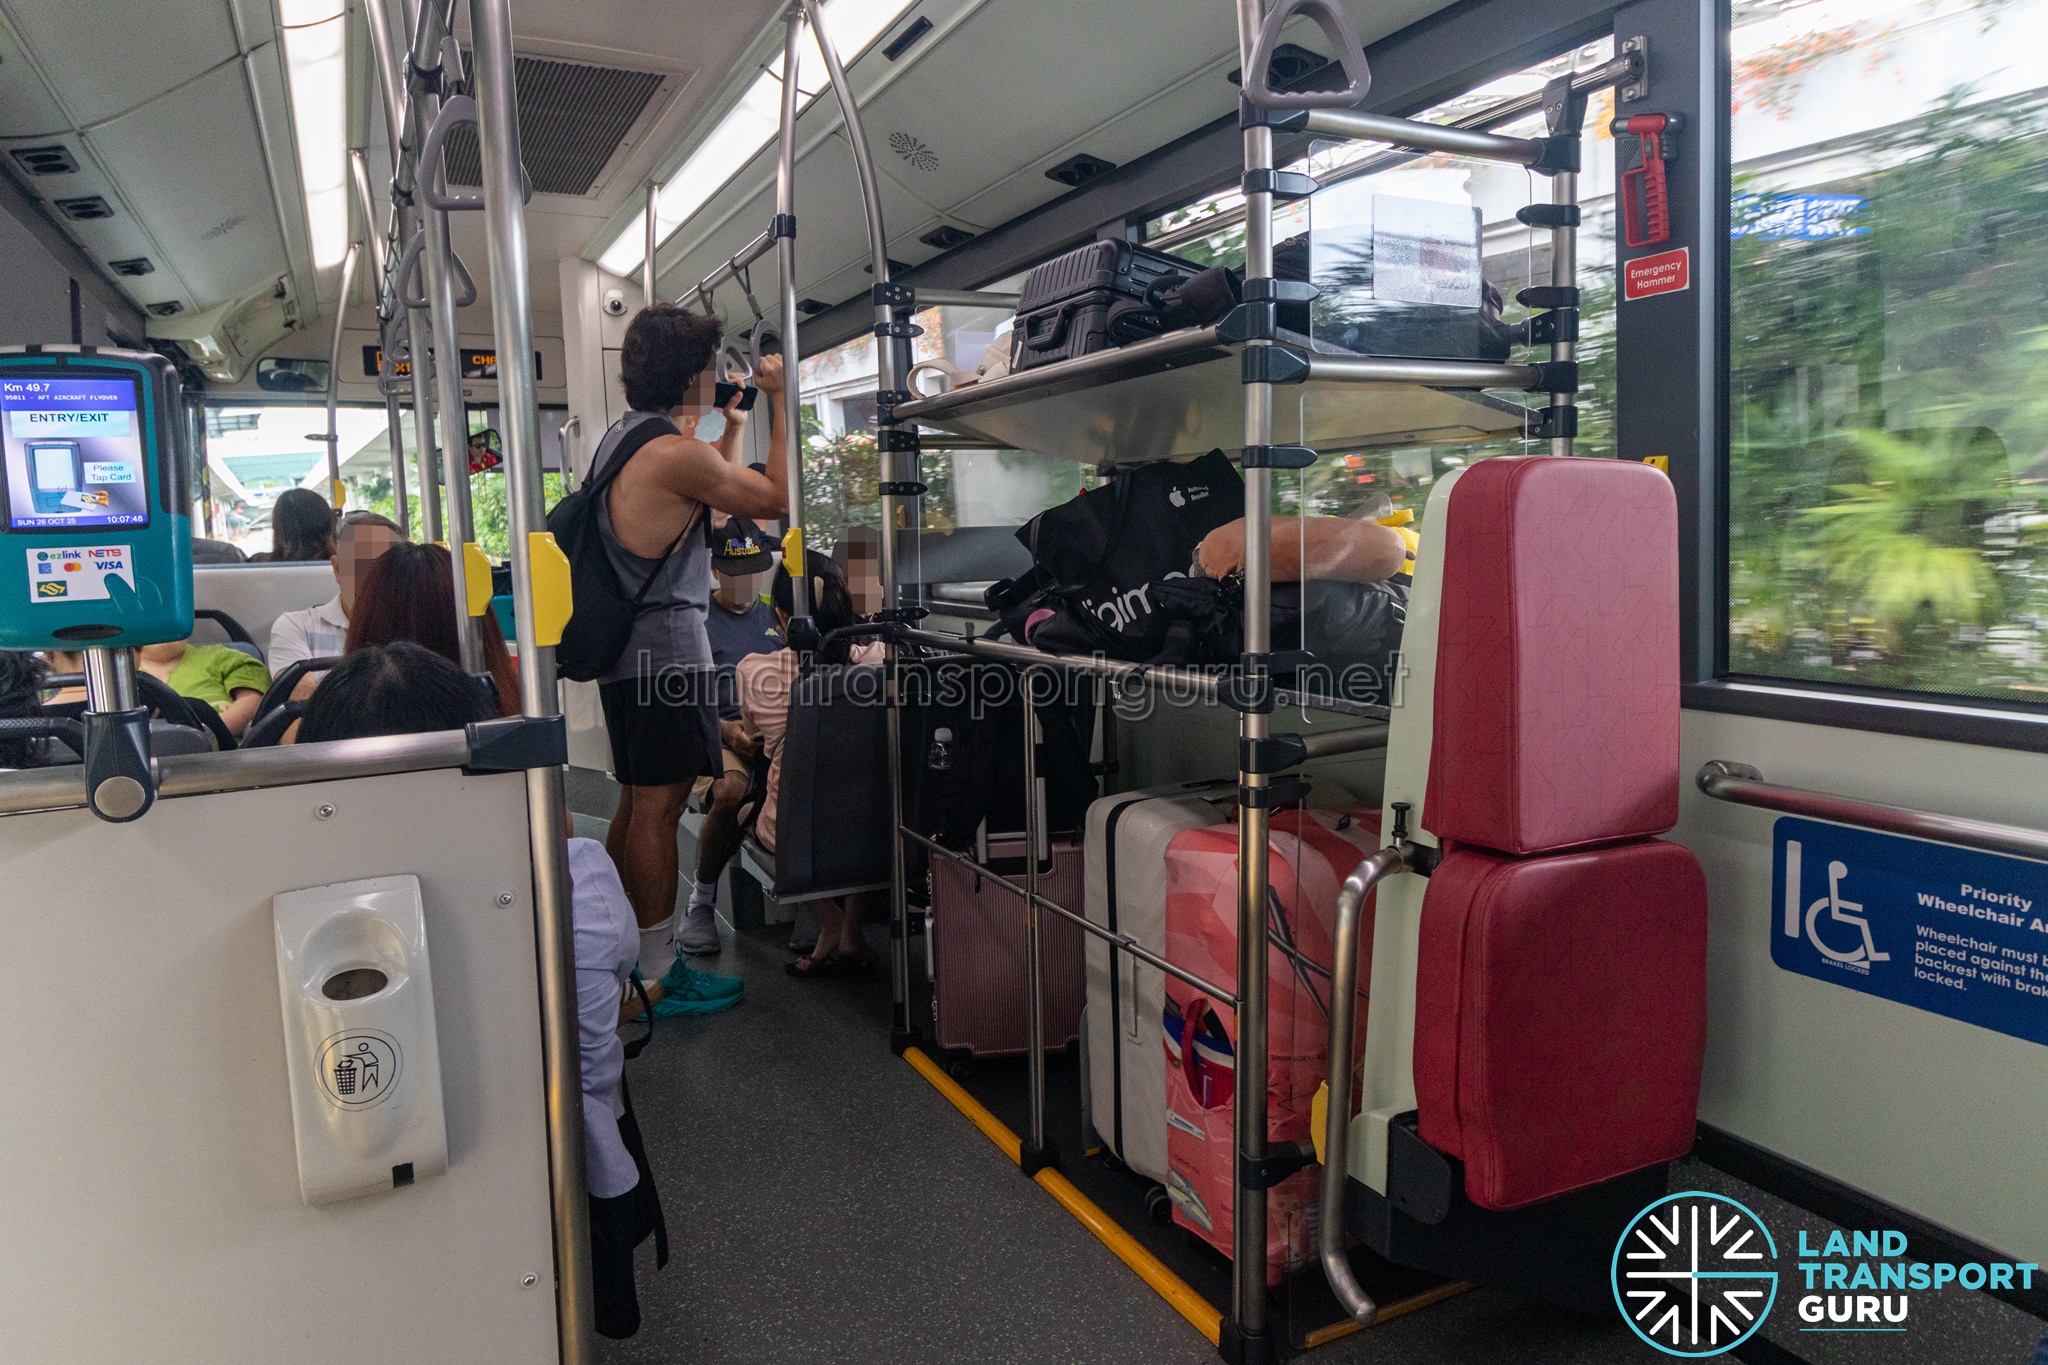
- Luggage Racks on Bus Service 36 (three-month trial in 2025; successful)
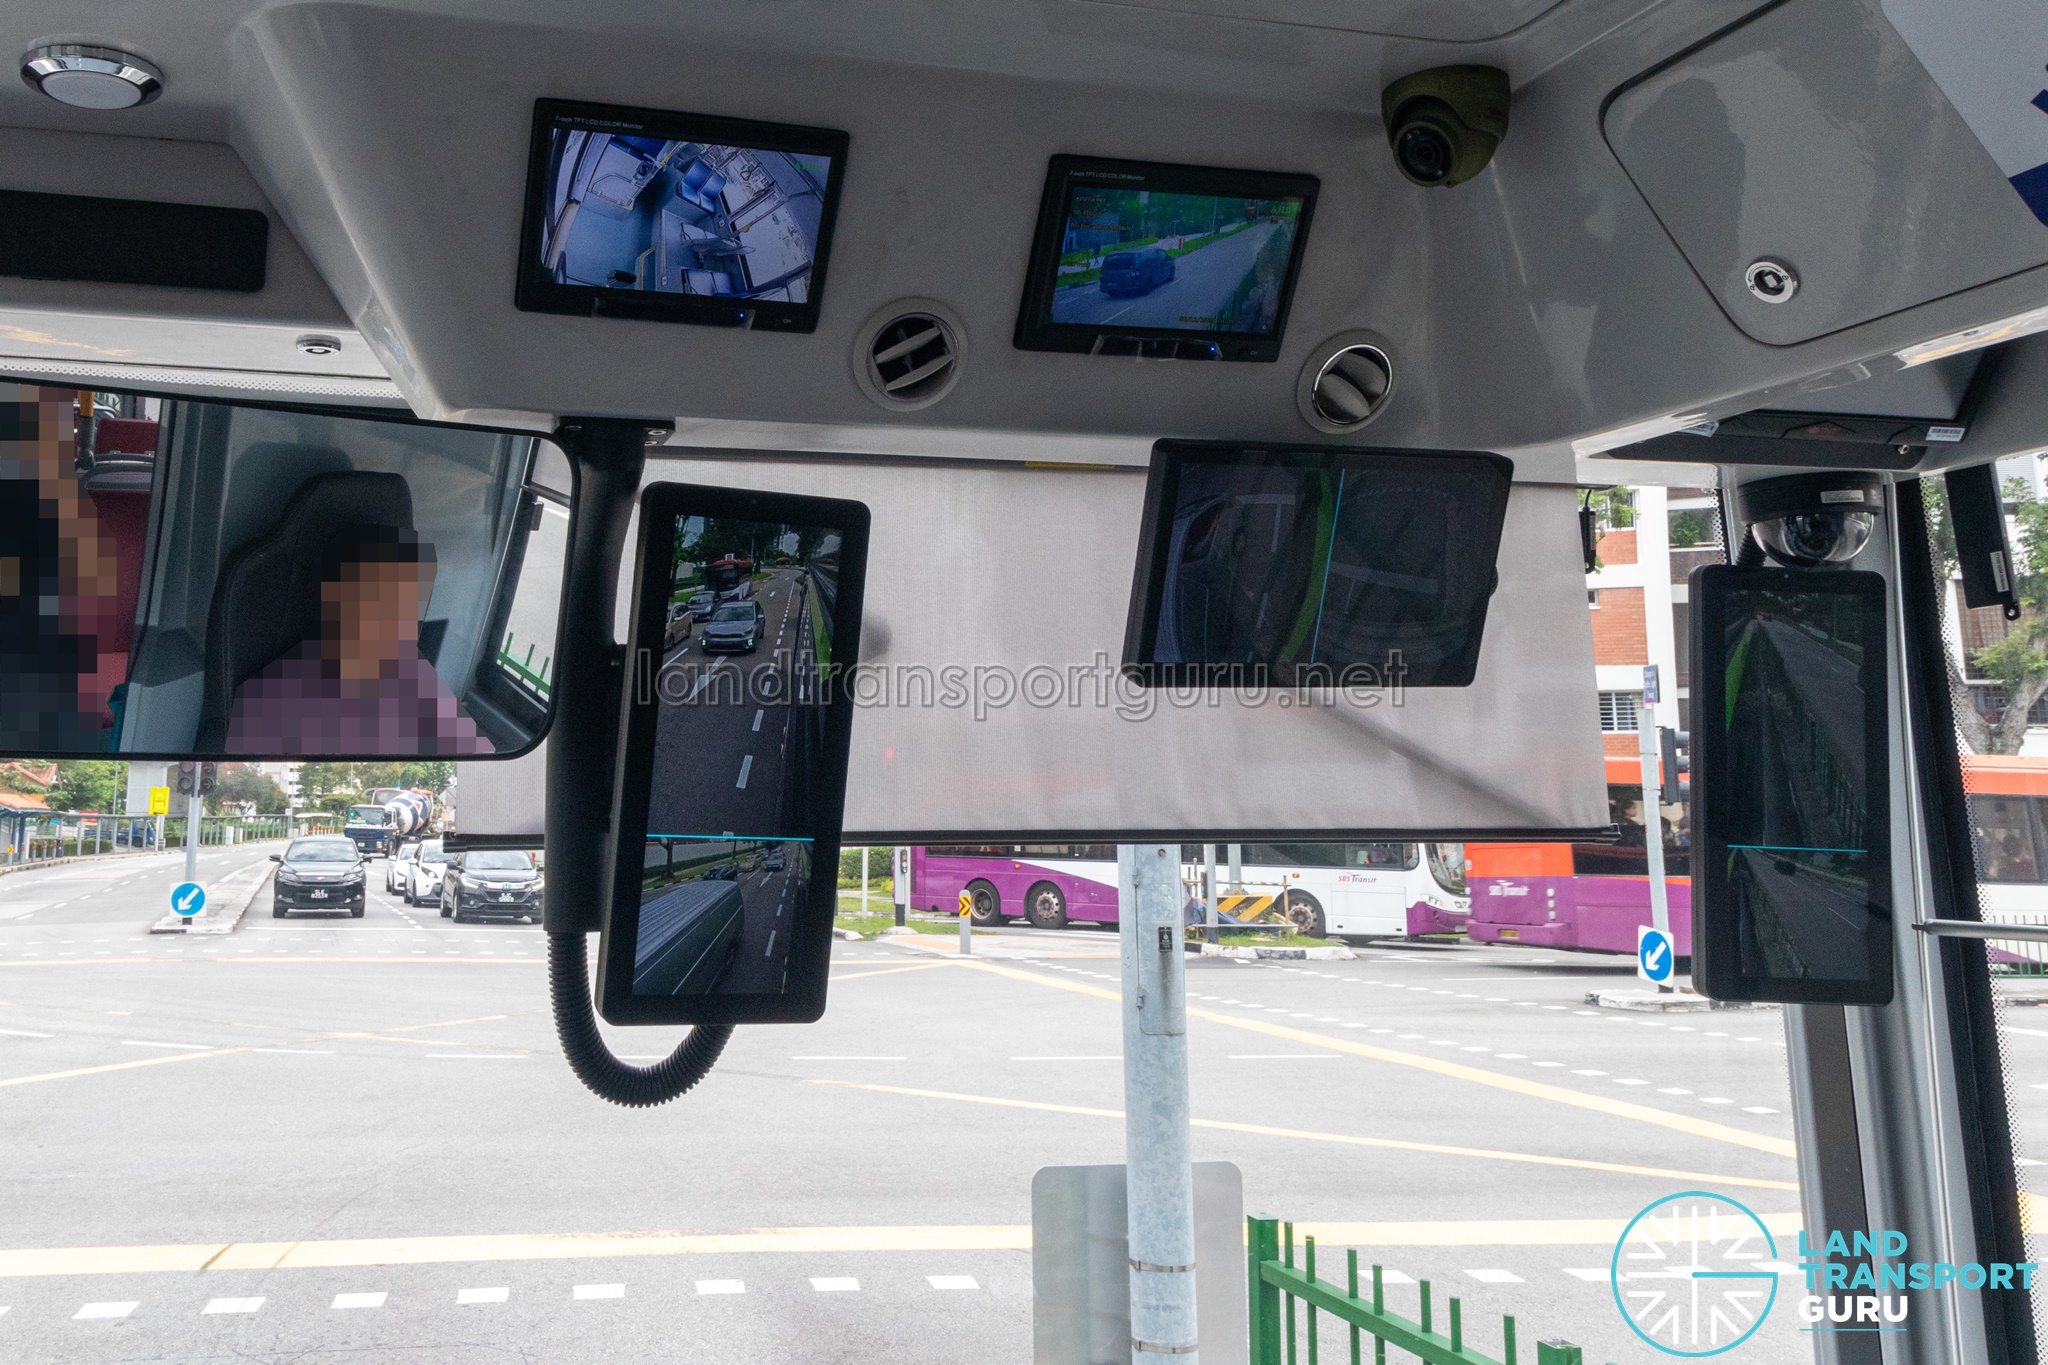
In defining bus procurement requirements, it also ushered in USB charging ports, Advanced Driver Assistance Systems (ADAS), and Anti-Fatigue Systems. From August 2025, new bus purchases also carry an AI-assisted 360-degree collision warning system and a camera mirror system as standard.
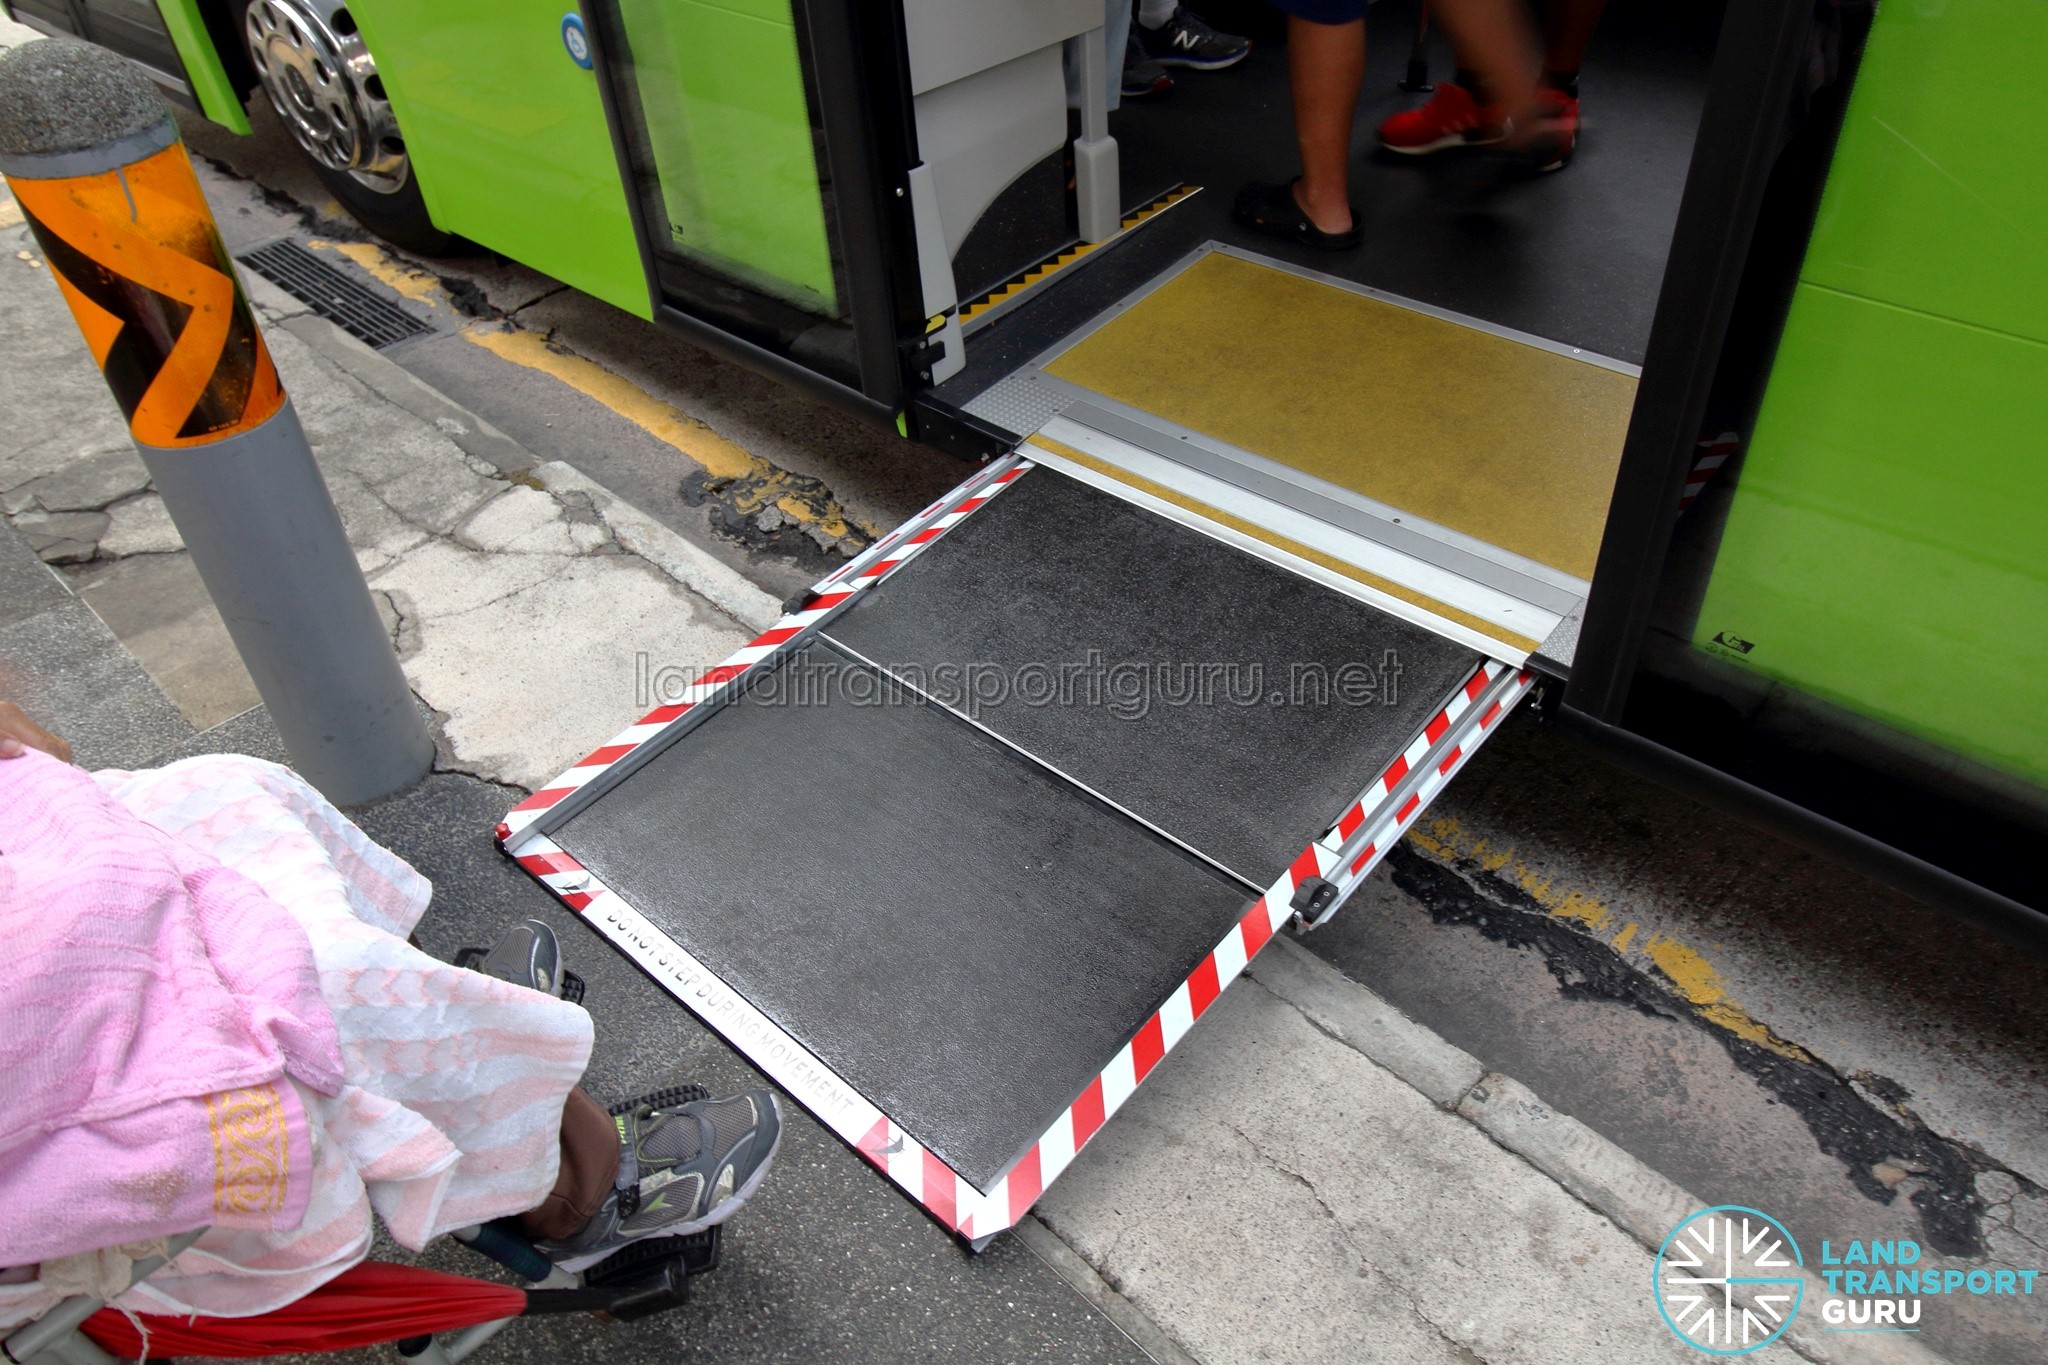
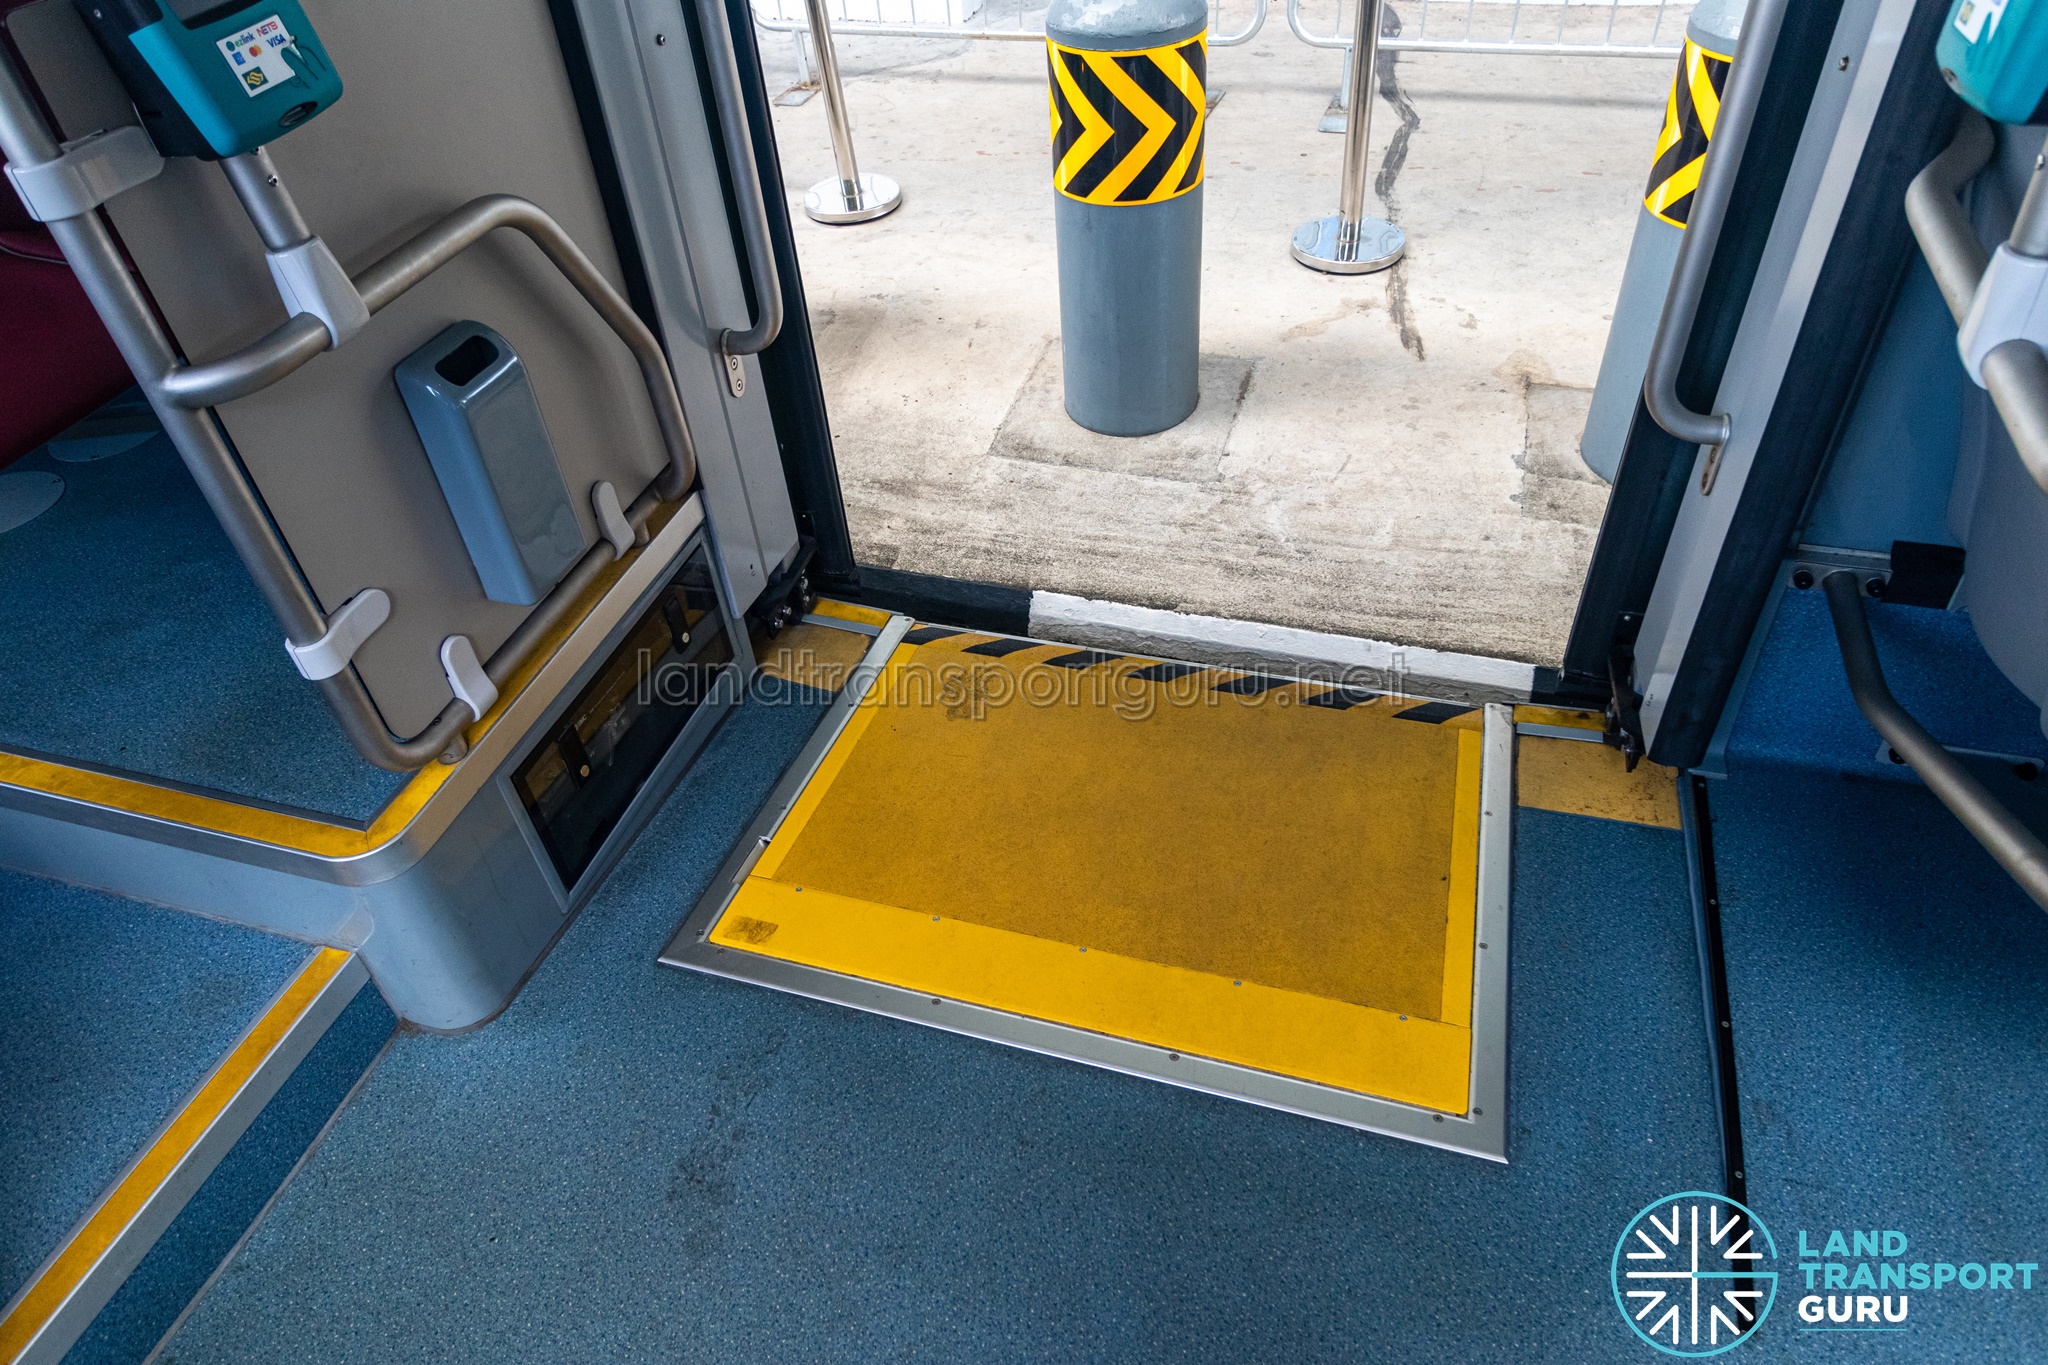
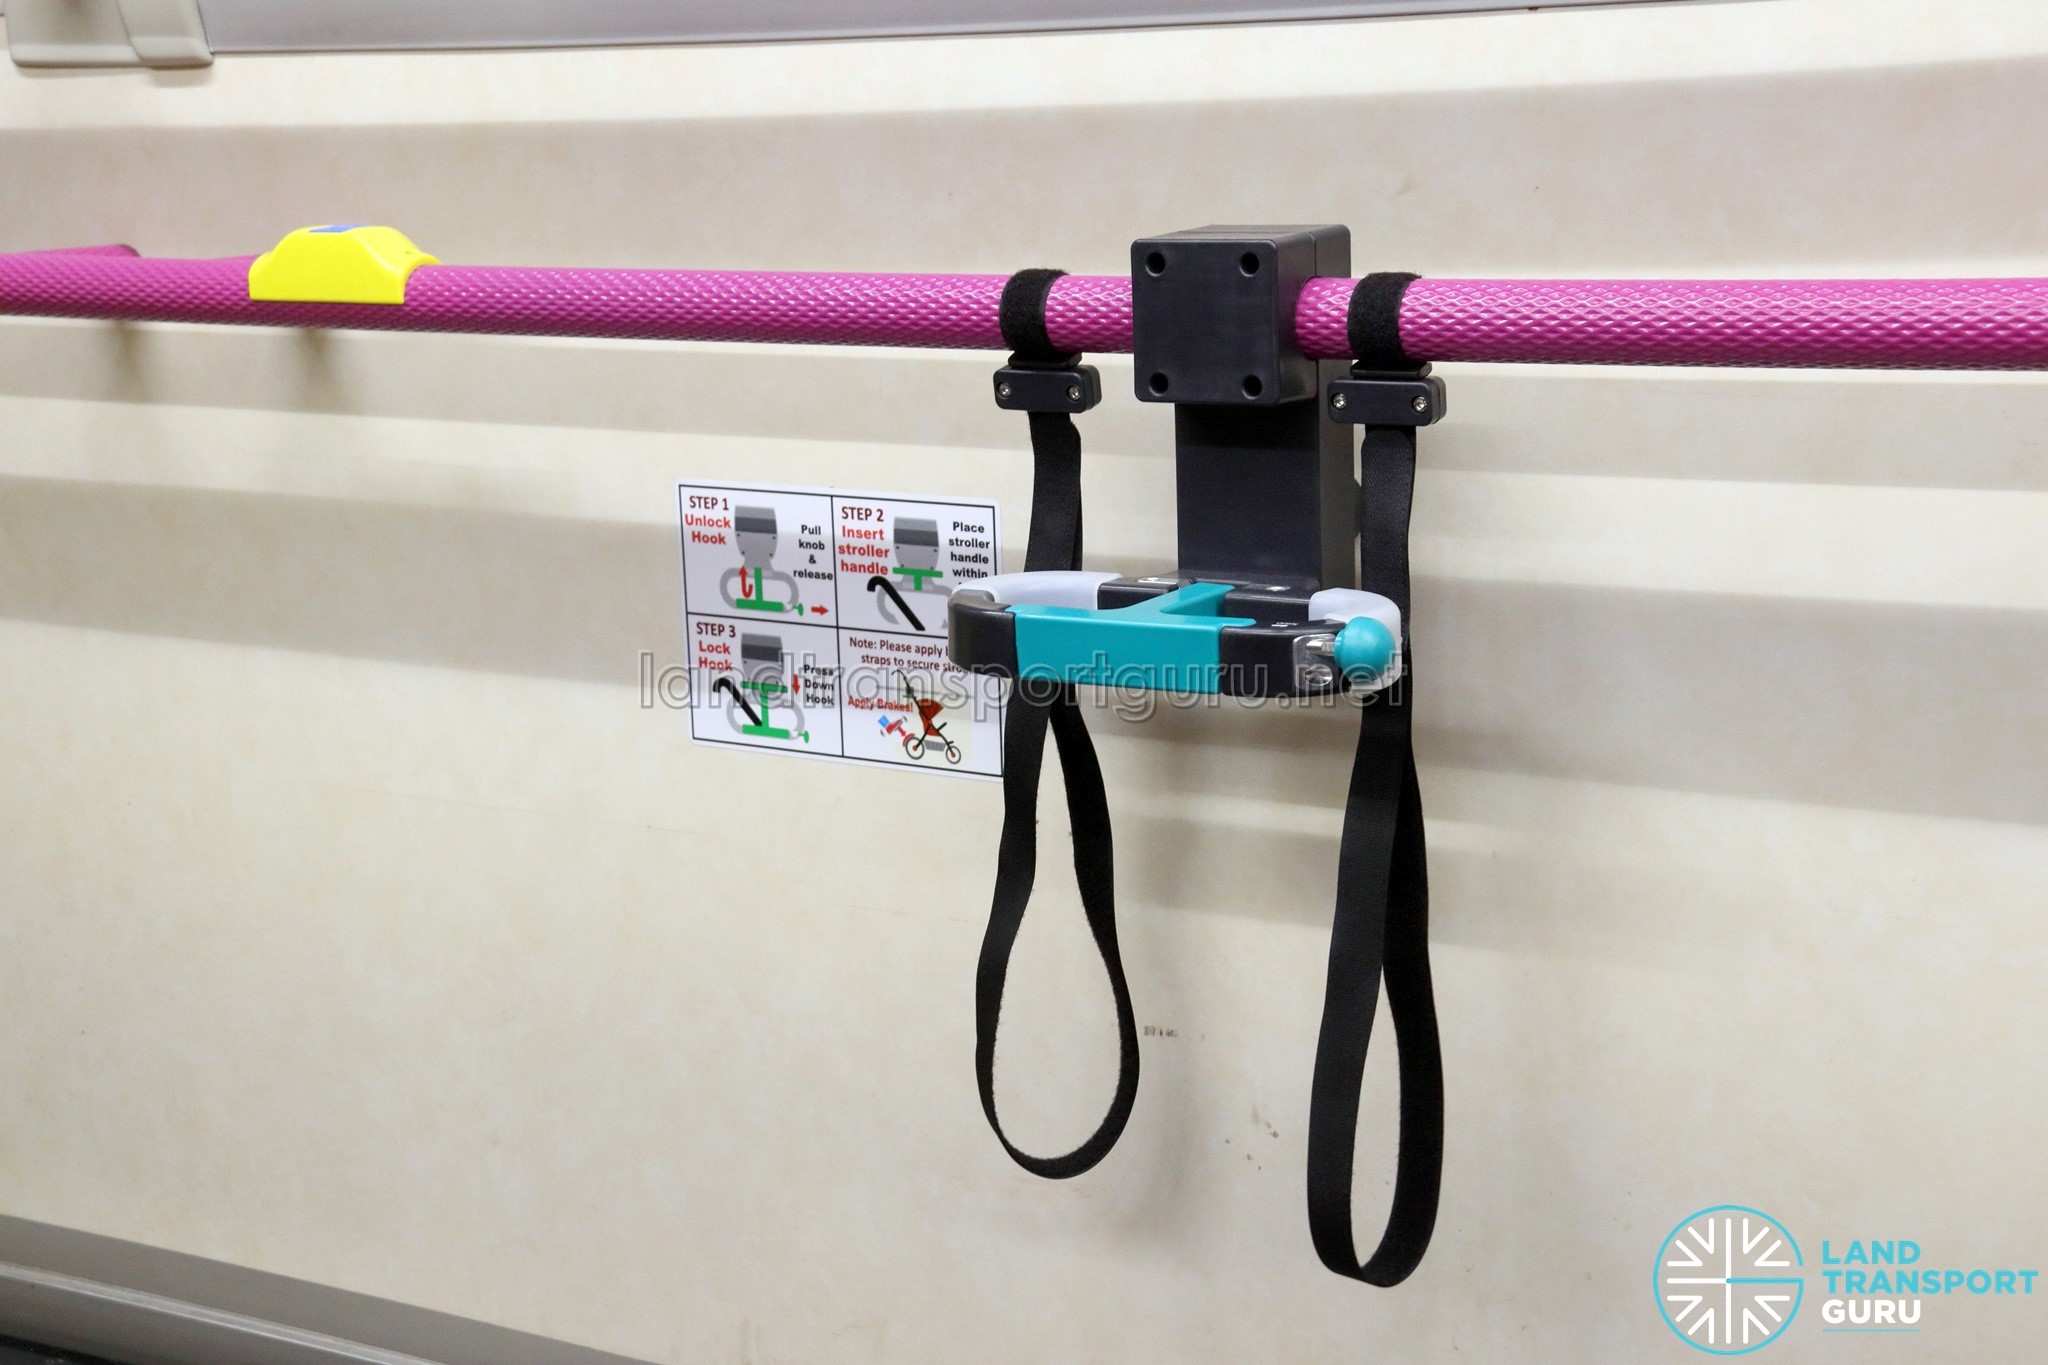
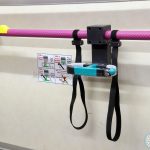
The adoption of automatic wheelchair ramps is a useful case study in how long these decisions can take to land: first trialled in September 2017 and initially not adopted, it only became standard under Contract PT601 — the 420-bus electric order awarded in November 2023, six years later.
The downsides: single-buyer decisions carry real, distributed costs
Centralised procurement cuts both ways. Because LTA alone sets bus specifications, operators — and passengers — must live with whatever LTA decides, and several of those decisions have not gone well:
Bendy buses phased out in favour of double-deckers
At their peak in the 2000s and early 2010s, Singapore ran more than 300 articulated (“bendy”) buses, dating back to Trans-Island Bus Services’ original 1996 order of 315 Mercedes-Benz O405G units. By 2025, only 40 bendy buses remain in service — all a single model, the MAN A24, split between SBS Transit (10, Seletar package), SMRT (23, Choa Chu Kang–Bukit Panjang and Woodlands) and Tower Transit (7, Sembawang–Yishun) — against a total public bus fleet of roughly 5,800.
LTA’s own stated rationale claims that both bus types carry a broadly similar number of passengers, but articulated buses need more road space, making them “less suited to Singapore’s dense urban landscape”, adding that double-deckers are more cost-effective thanks to a simpler mechanical design and lower maintenance needs.
On the other hand, this ignores real operational advantages bendy buses have on high-turnover feeder routes: a continuous low floor and multiple doors that speed up boarding and alighting, with no stairs to navigate. Bendy buses can also access height-restricted areas like Changi Airport’s basement bus terminal that double-deckers cannot reach.
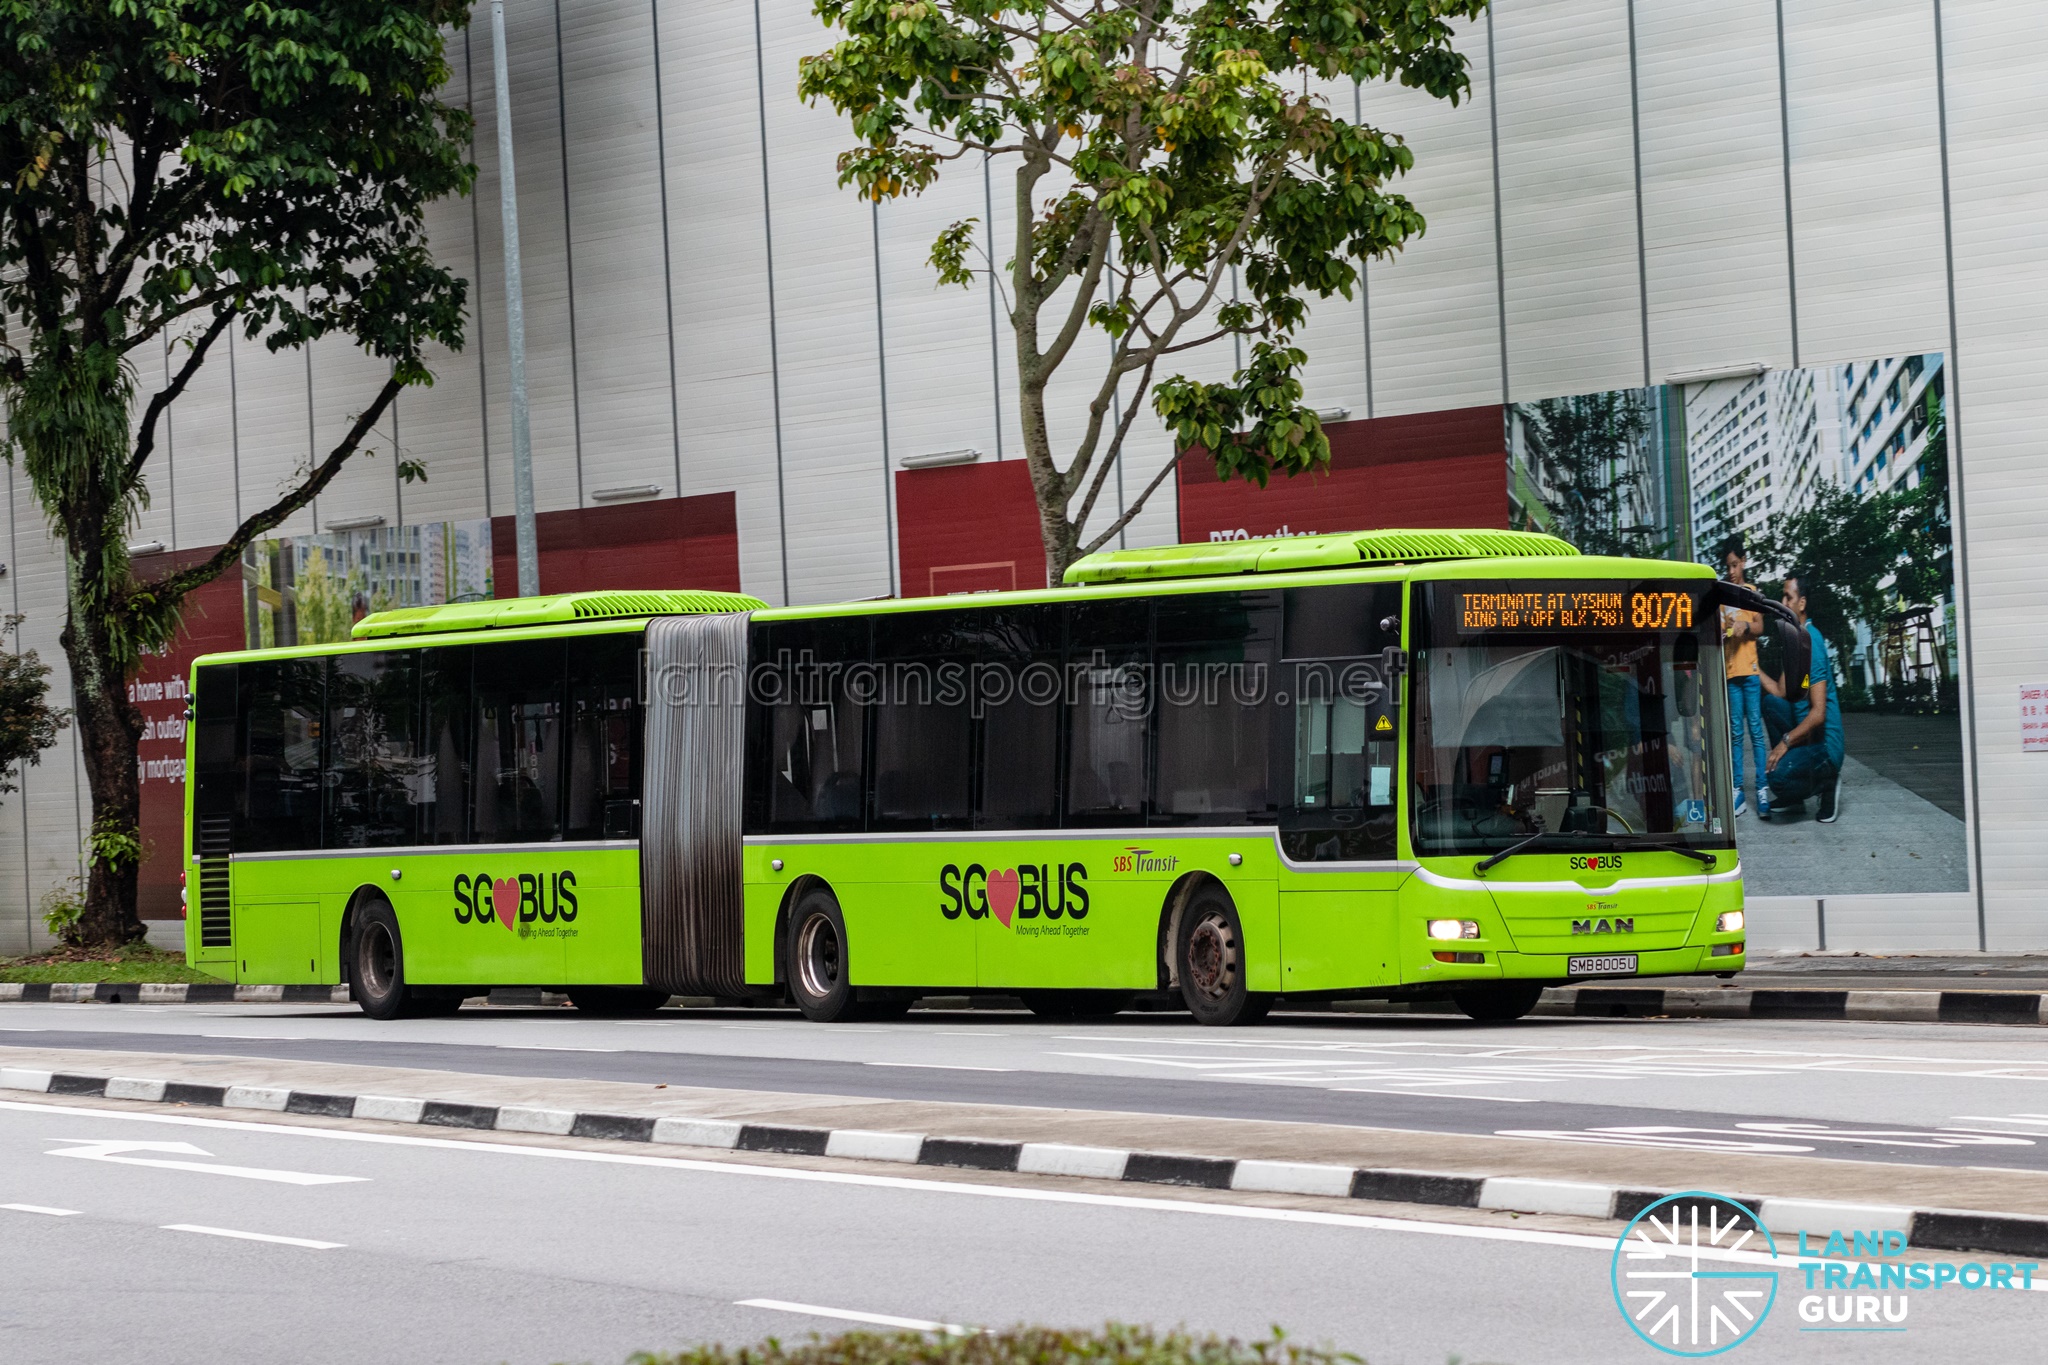
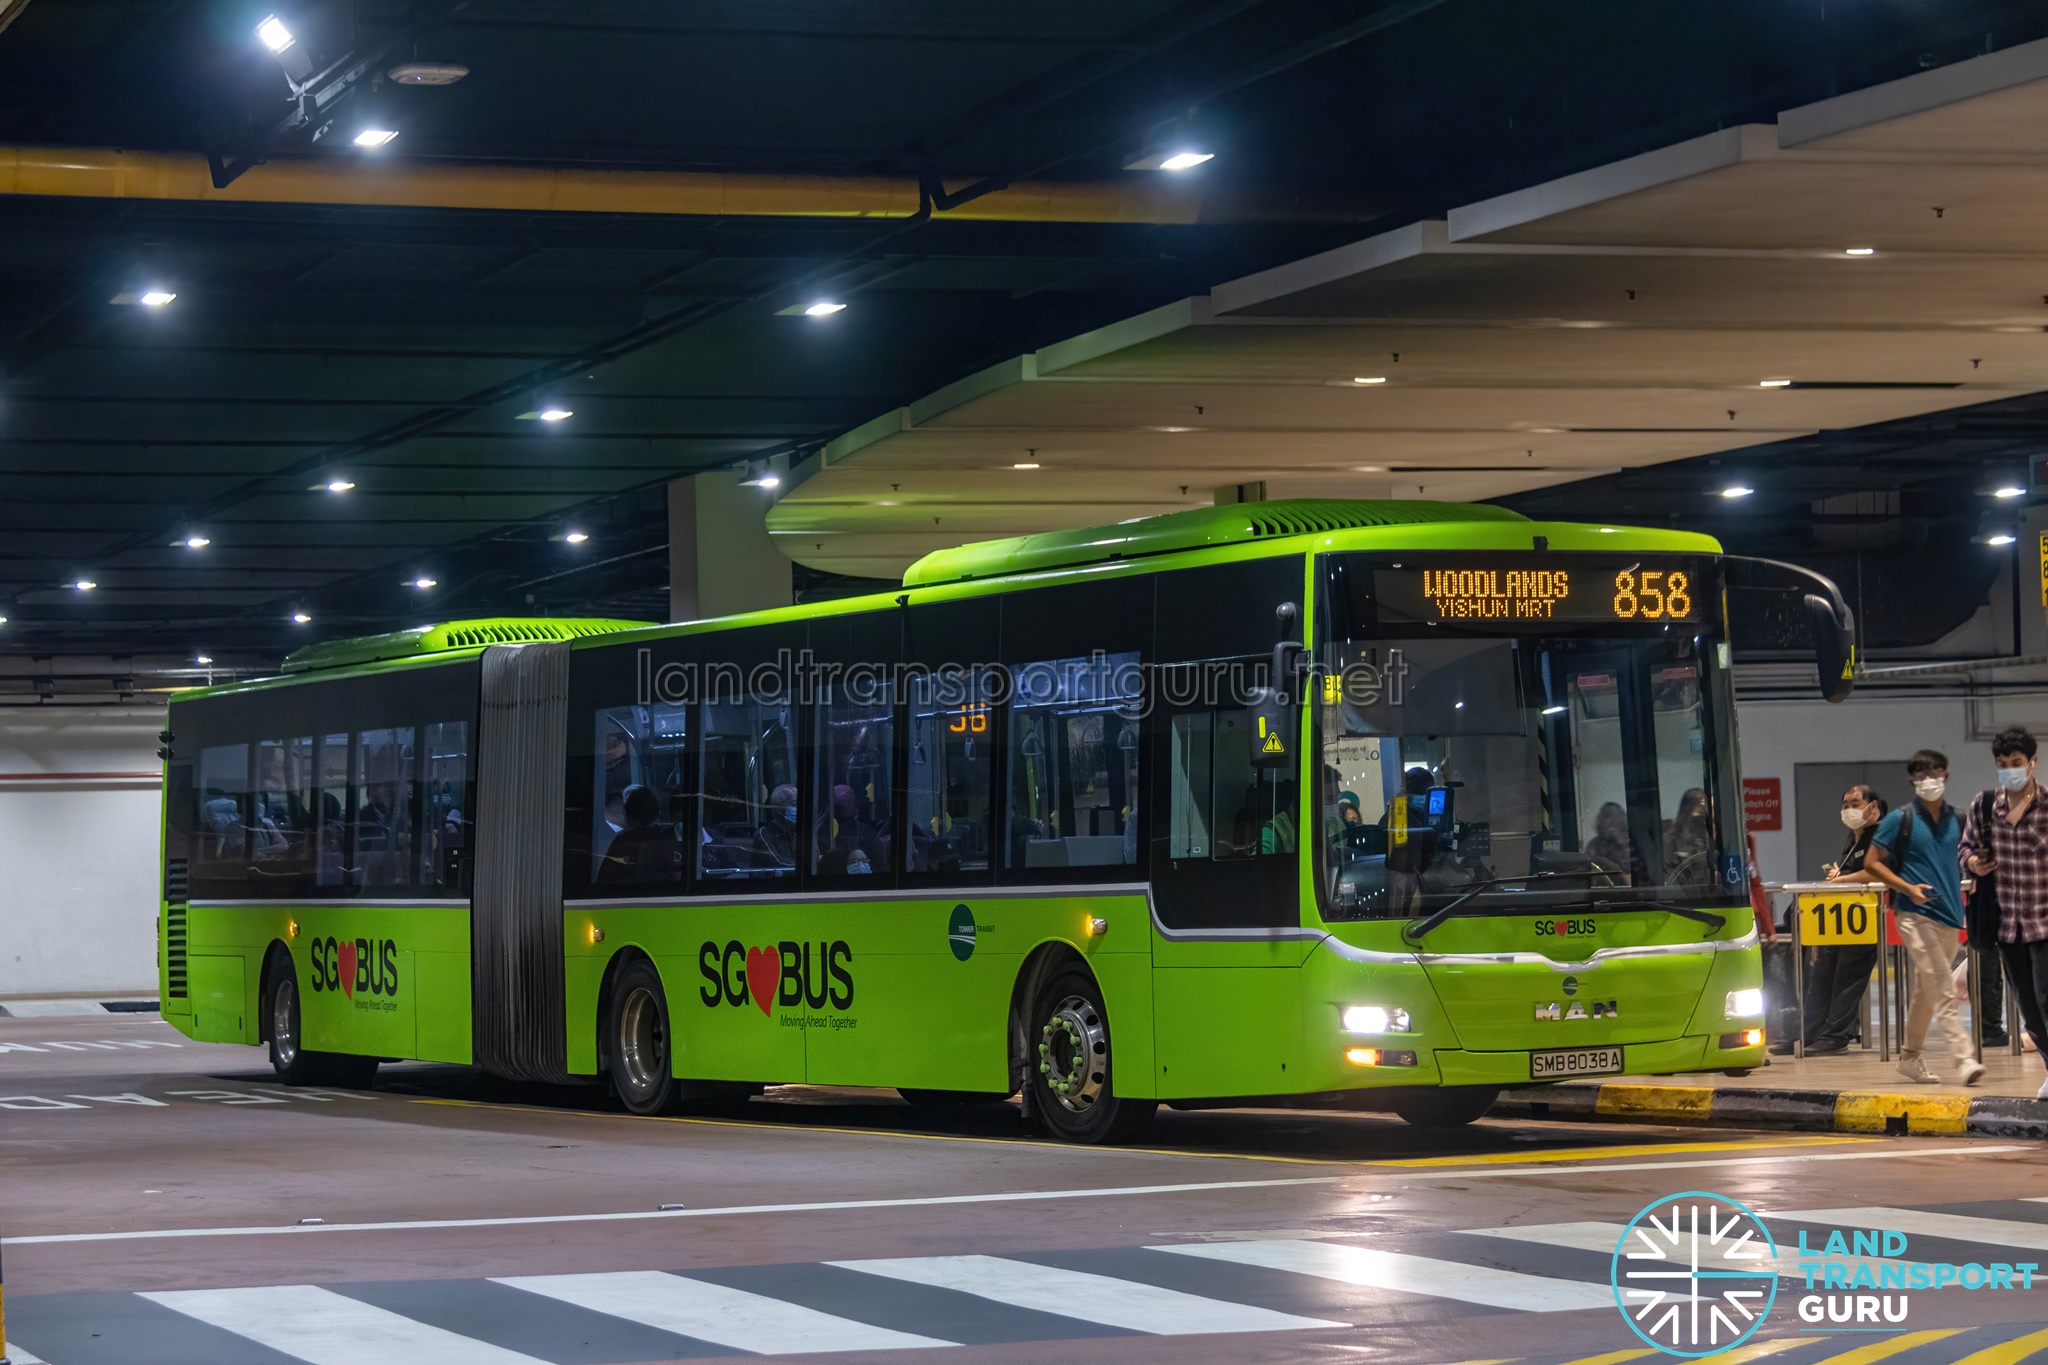
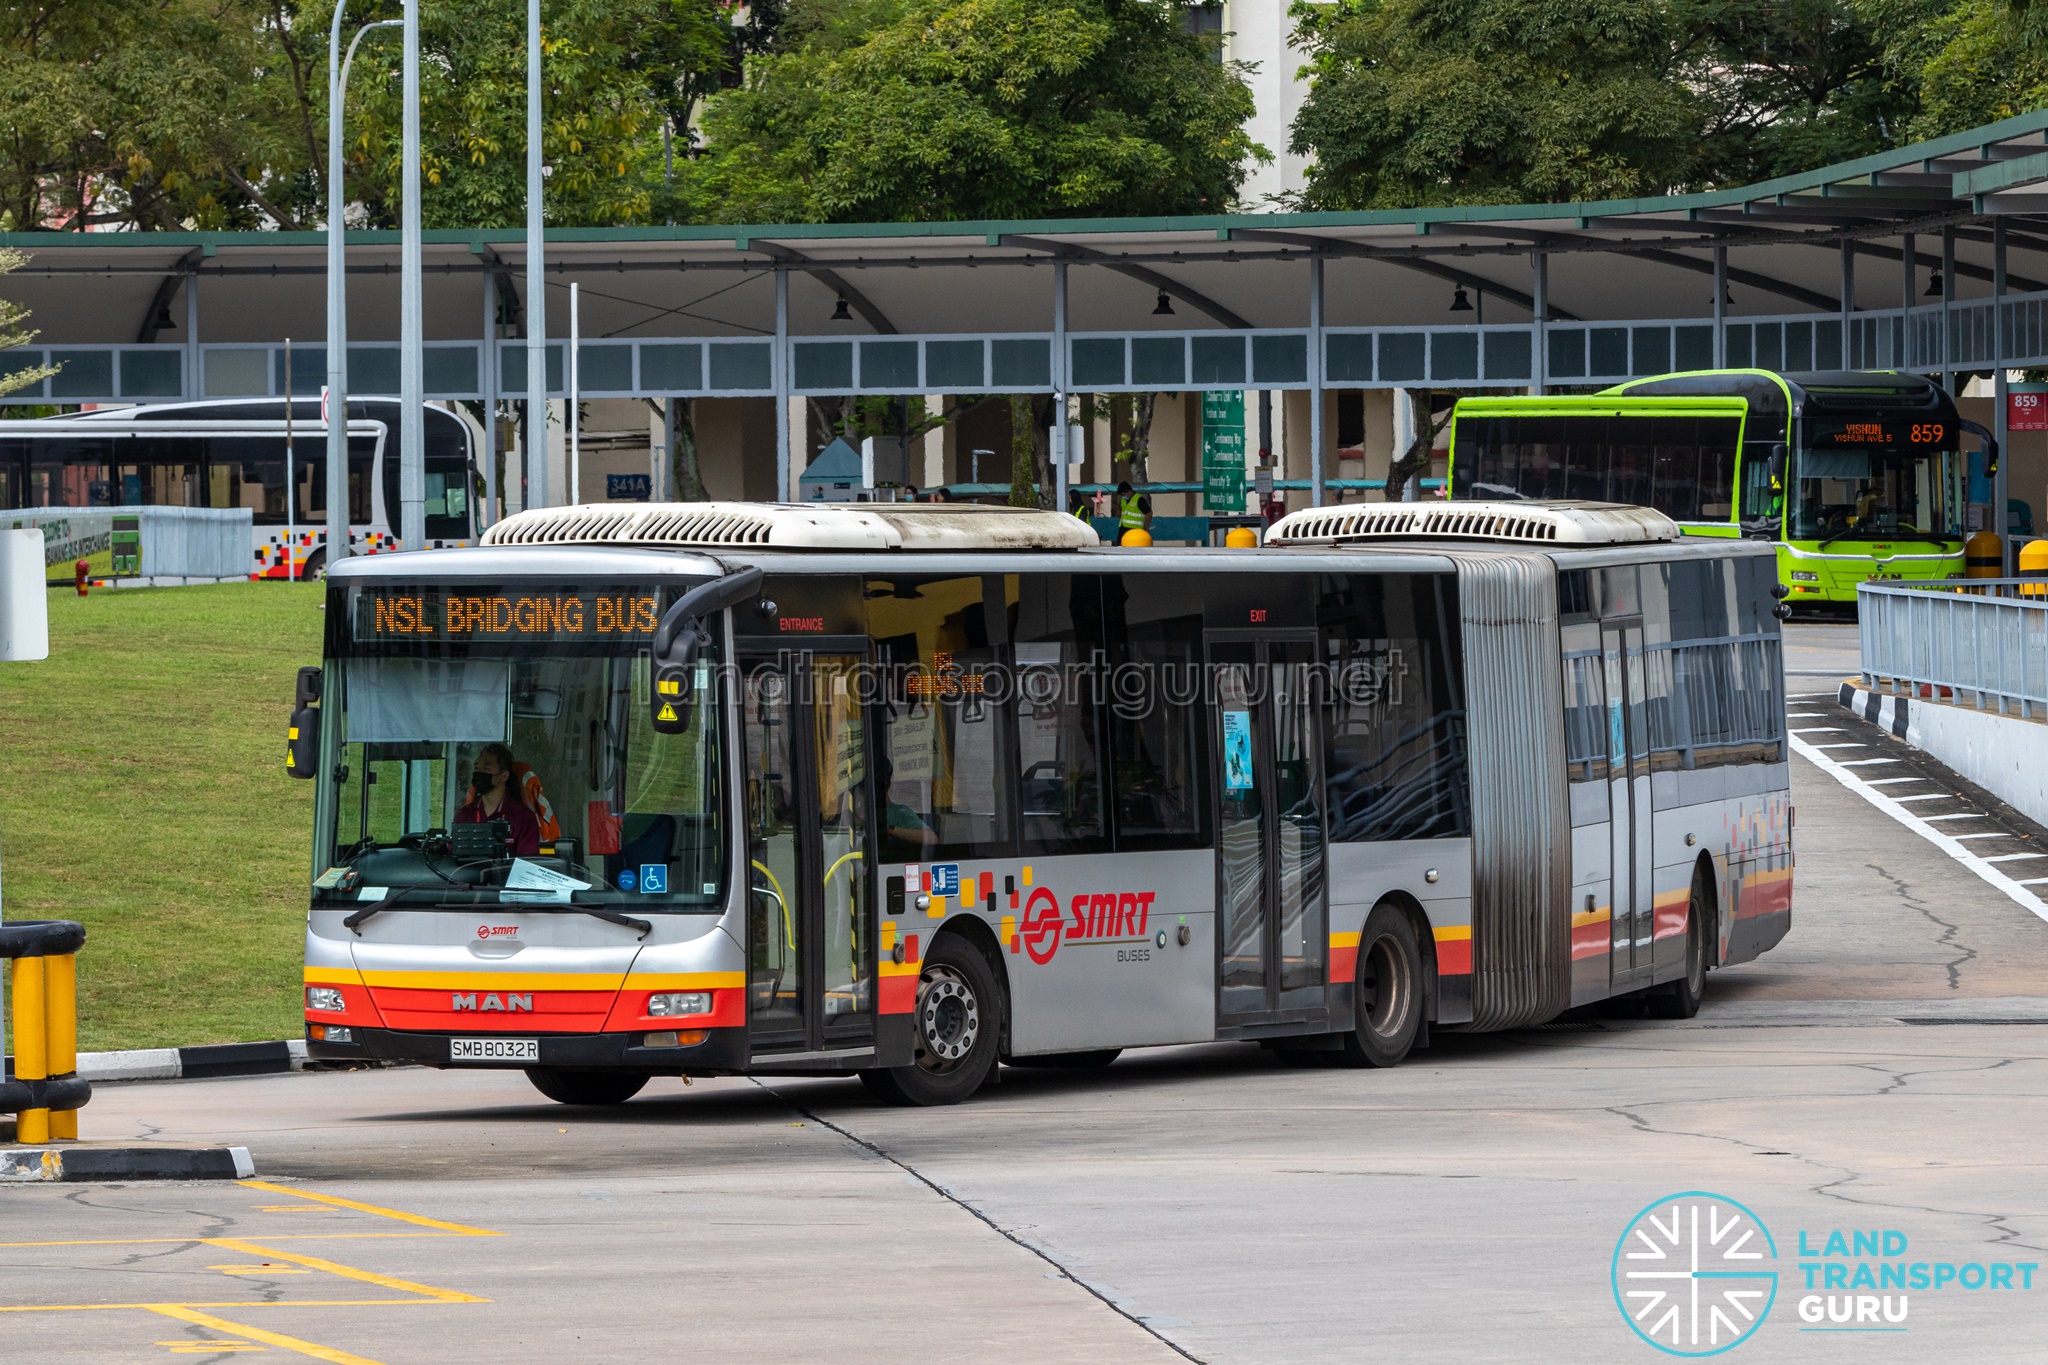
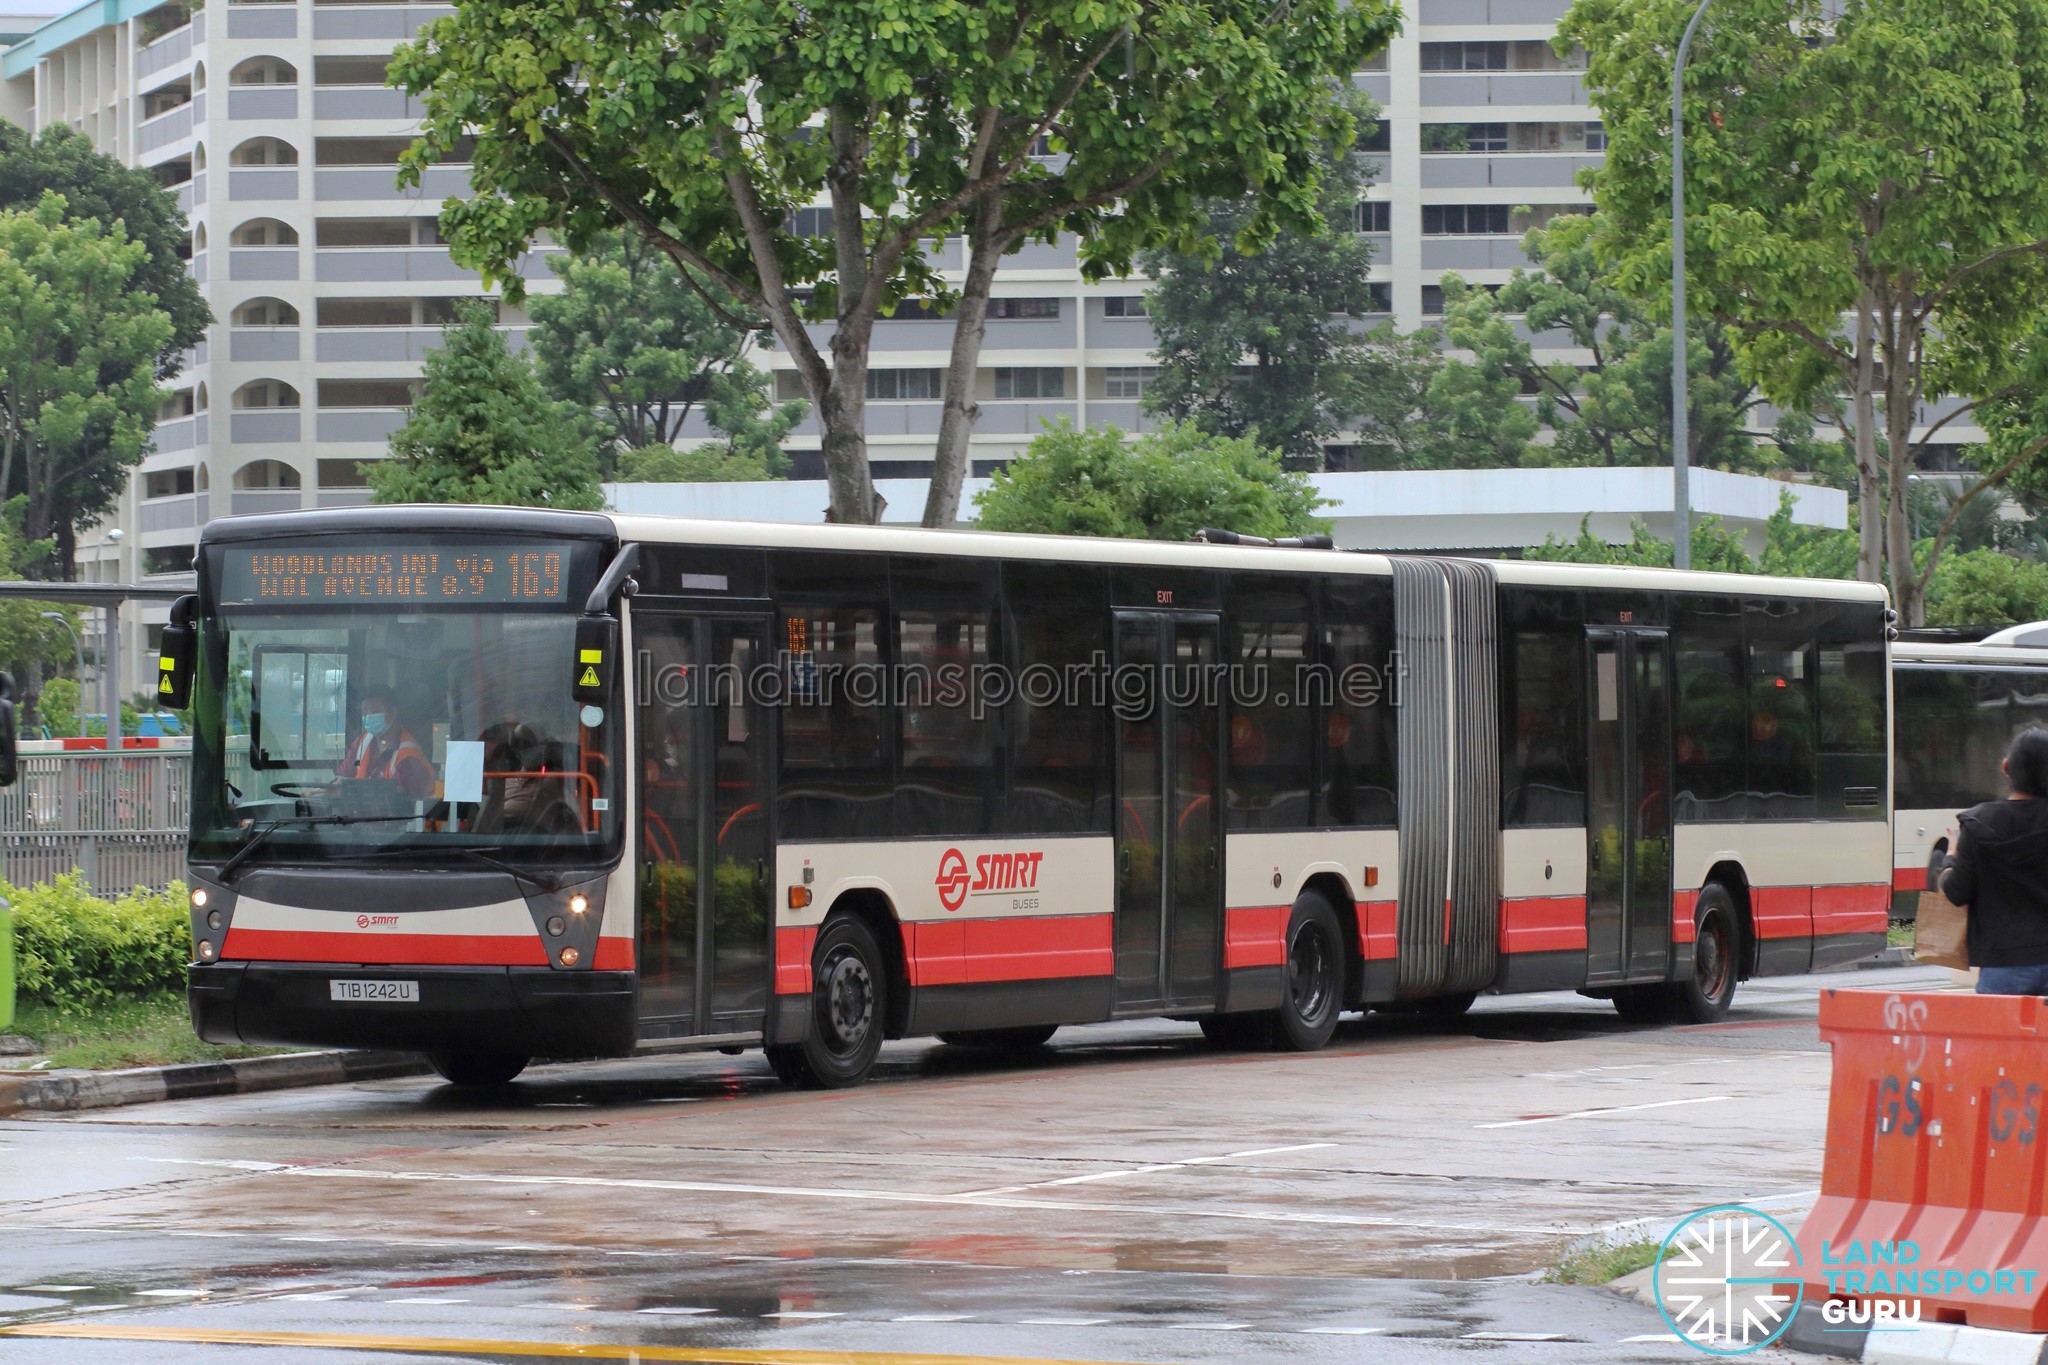
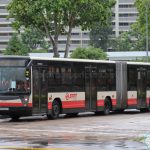
There are small signs LTA hasn’t entirely closed the door on bendies — new Integrated Transport Hubs at Woodleigh and Pasir Ris retain berths sized for 18-metre articulated buses; the planned Ang Mo Kio multi-storey depot reserves space for up to 50 of them, and in July 2026, LTA began assessing a Bus Rapid Transit system for Tuas South, a transport mode that typically relies on articulated vehicles.
See: Articulated buses in Singapore | Land Transport Guru
Equal ADL/MAN 3-Door DD allocation despite unequal accessibility
When LTA procured 100 units of 3-door Euro 6 double-deckers in 2019, it split the order evenly between 50 ADL Enviro500 (3 Door) and 50 MAN A95 (3 Door), despite the ADL’s meaningfully better layout — its full low-floor design and rear staircase lead directly to the third door, which encourages its use by upper-deck passengers.
In contrast, the MAN A95’s low-headroom rear section, narrow exit stairs, and indirectly placed rear staircase make the third door less useful in practice.
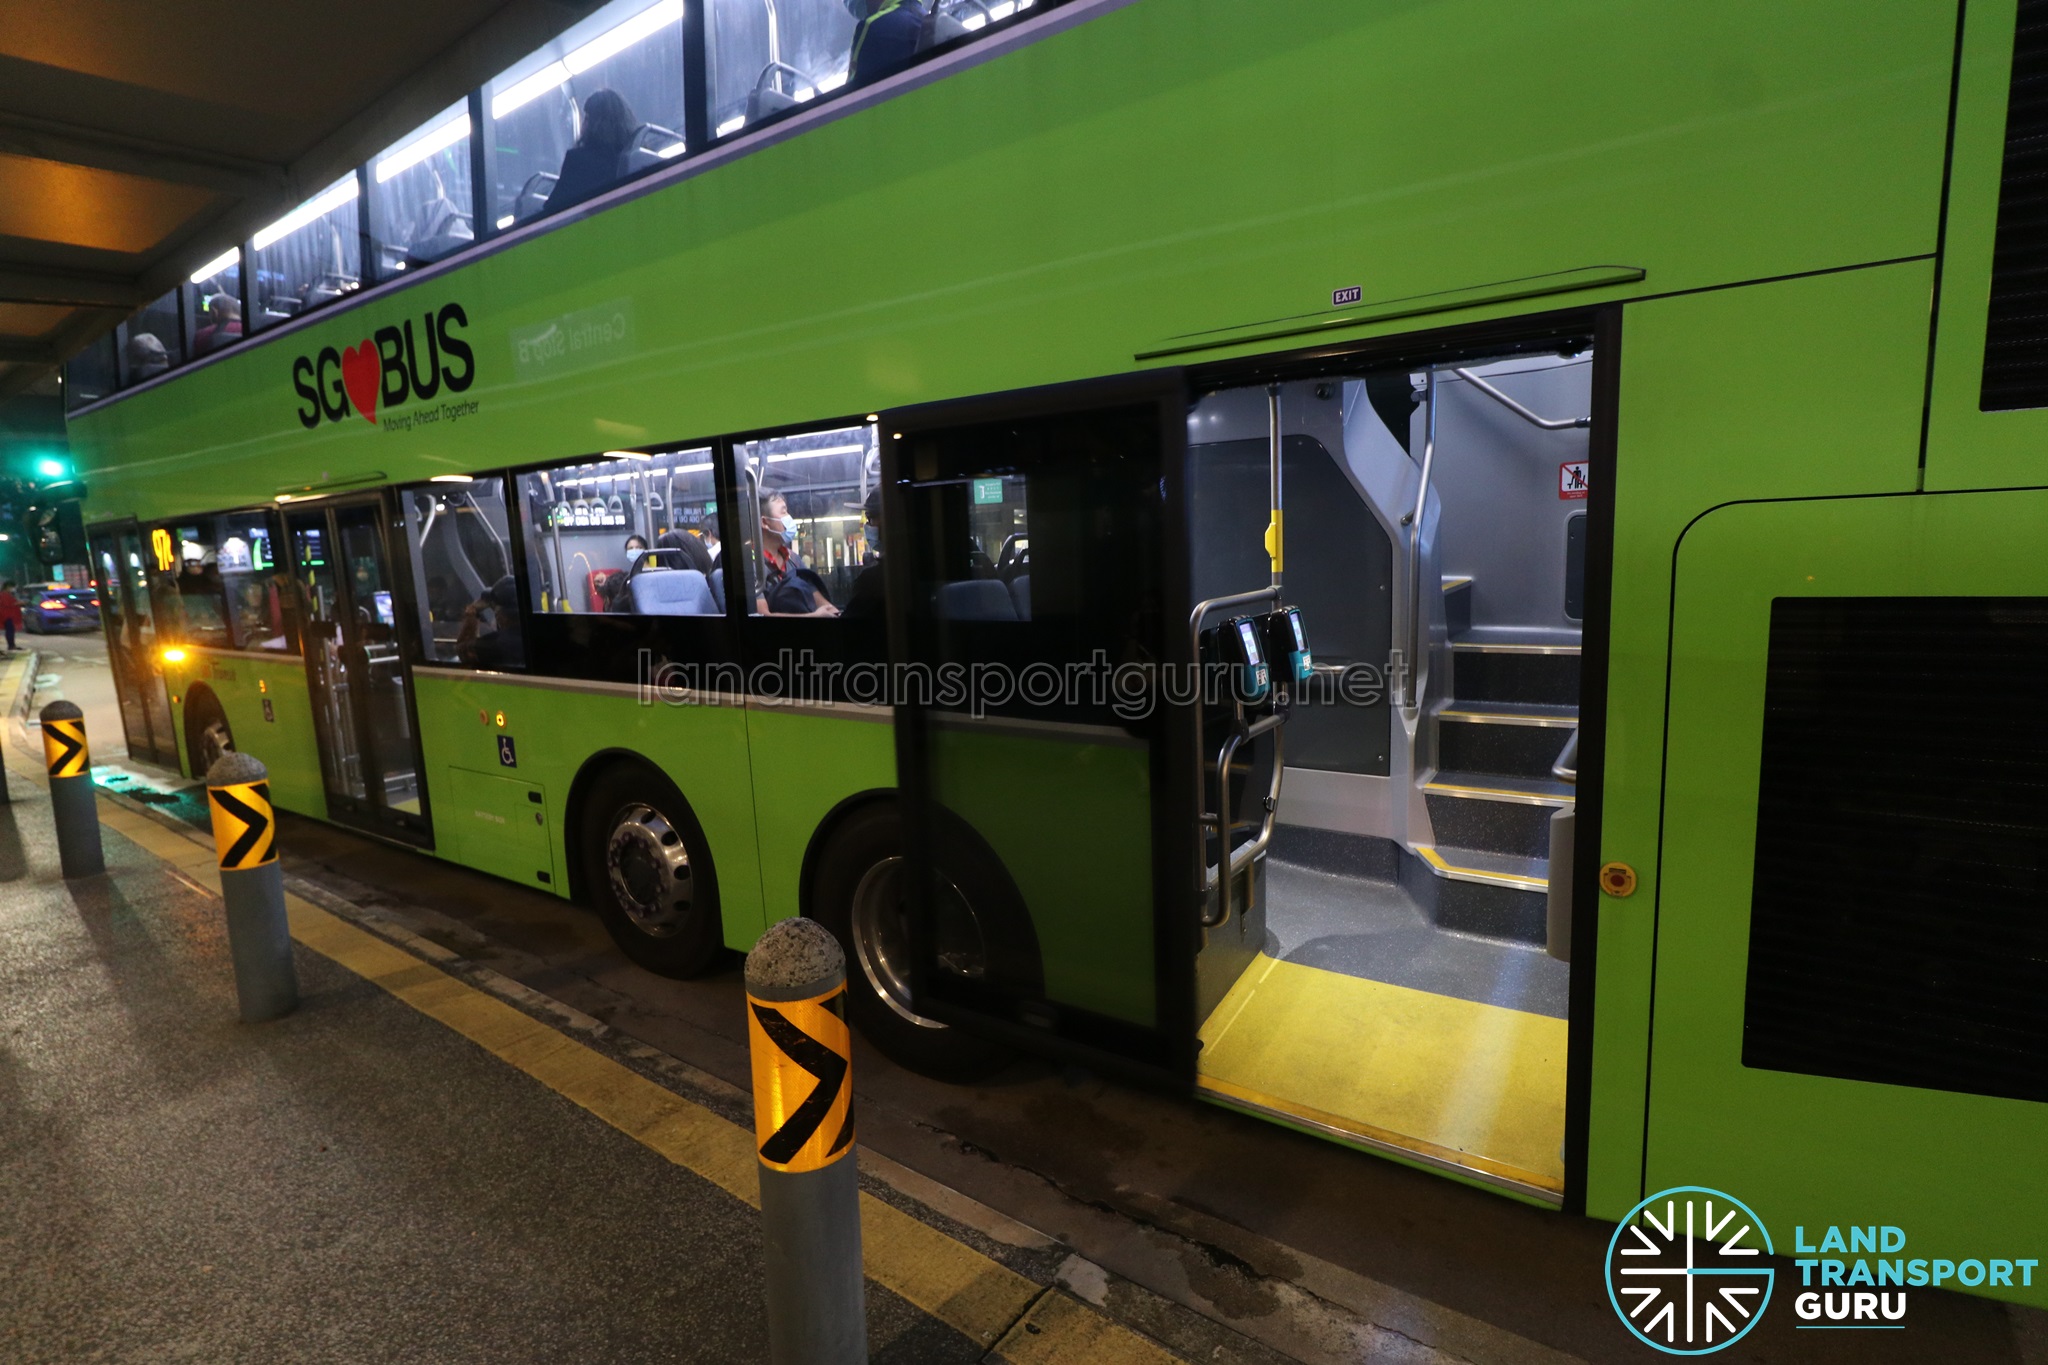
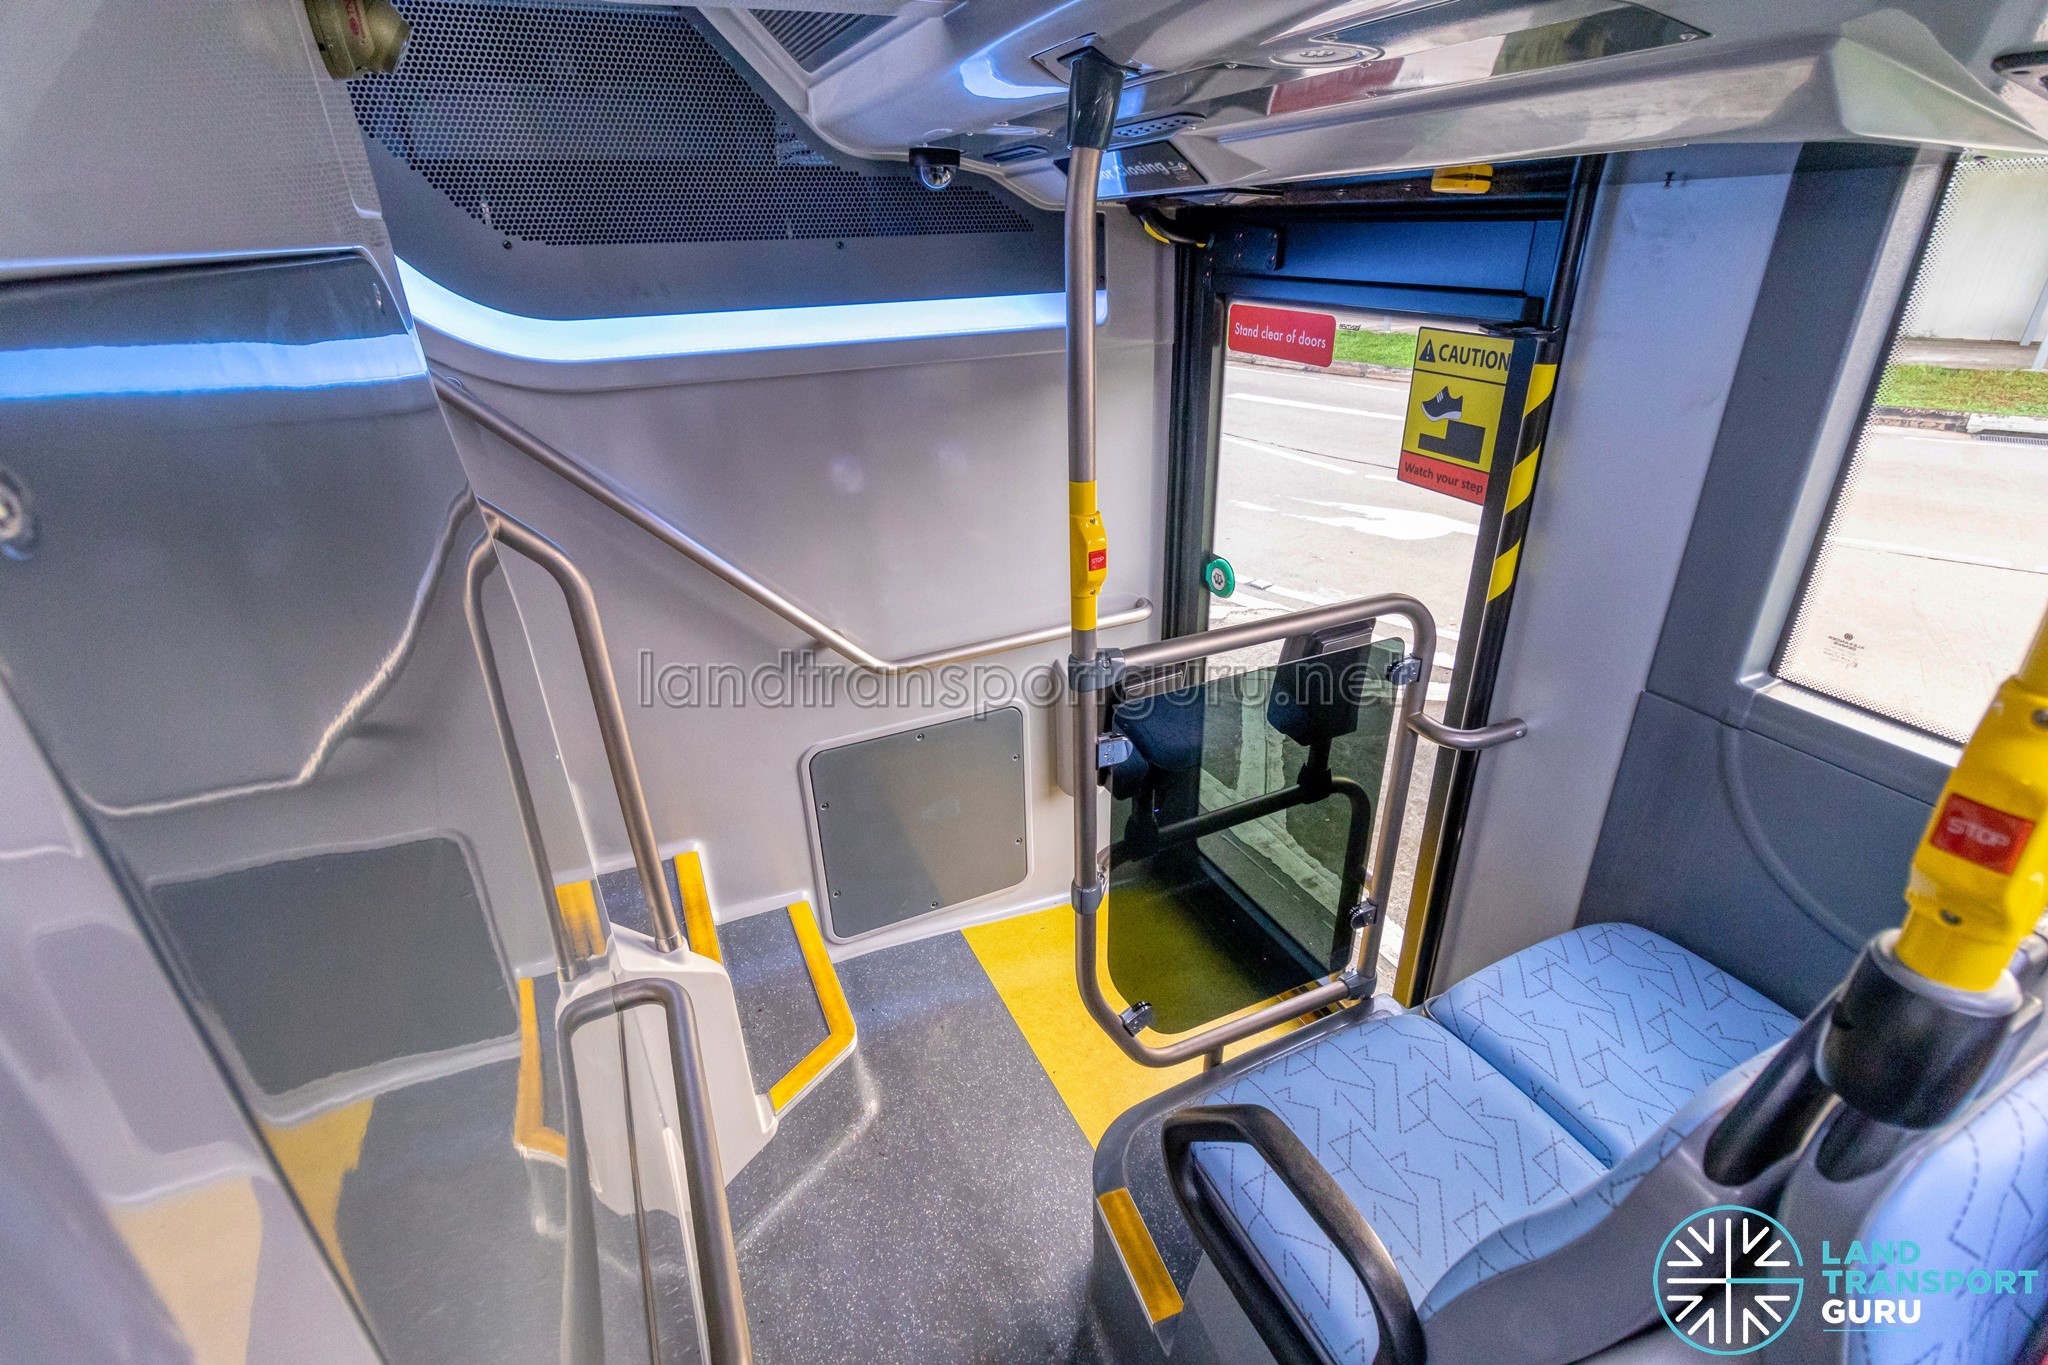
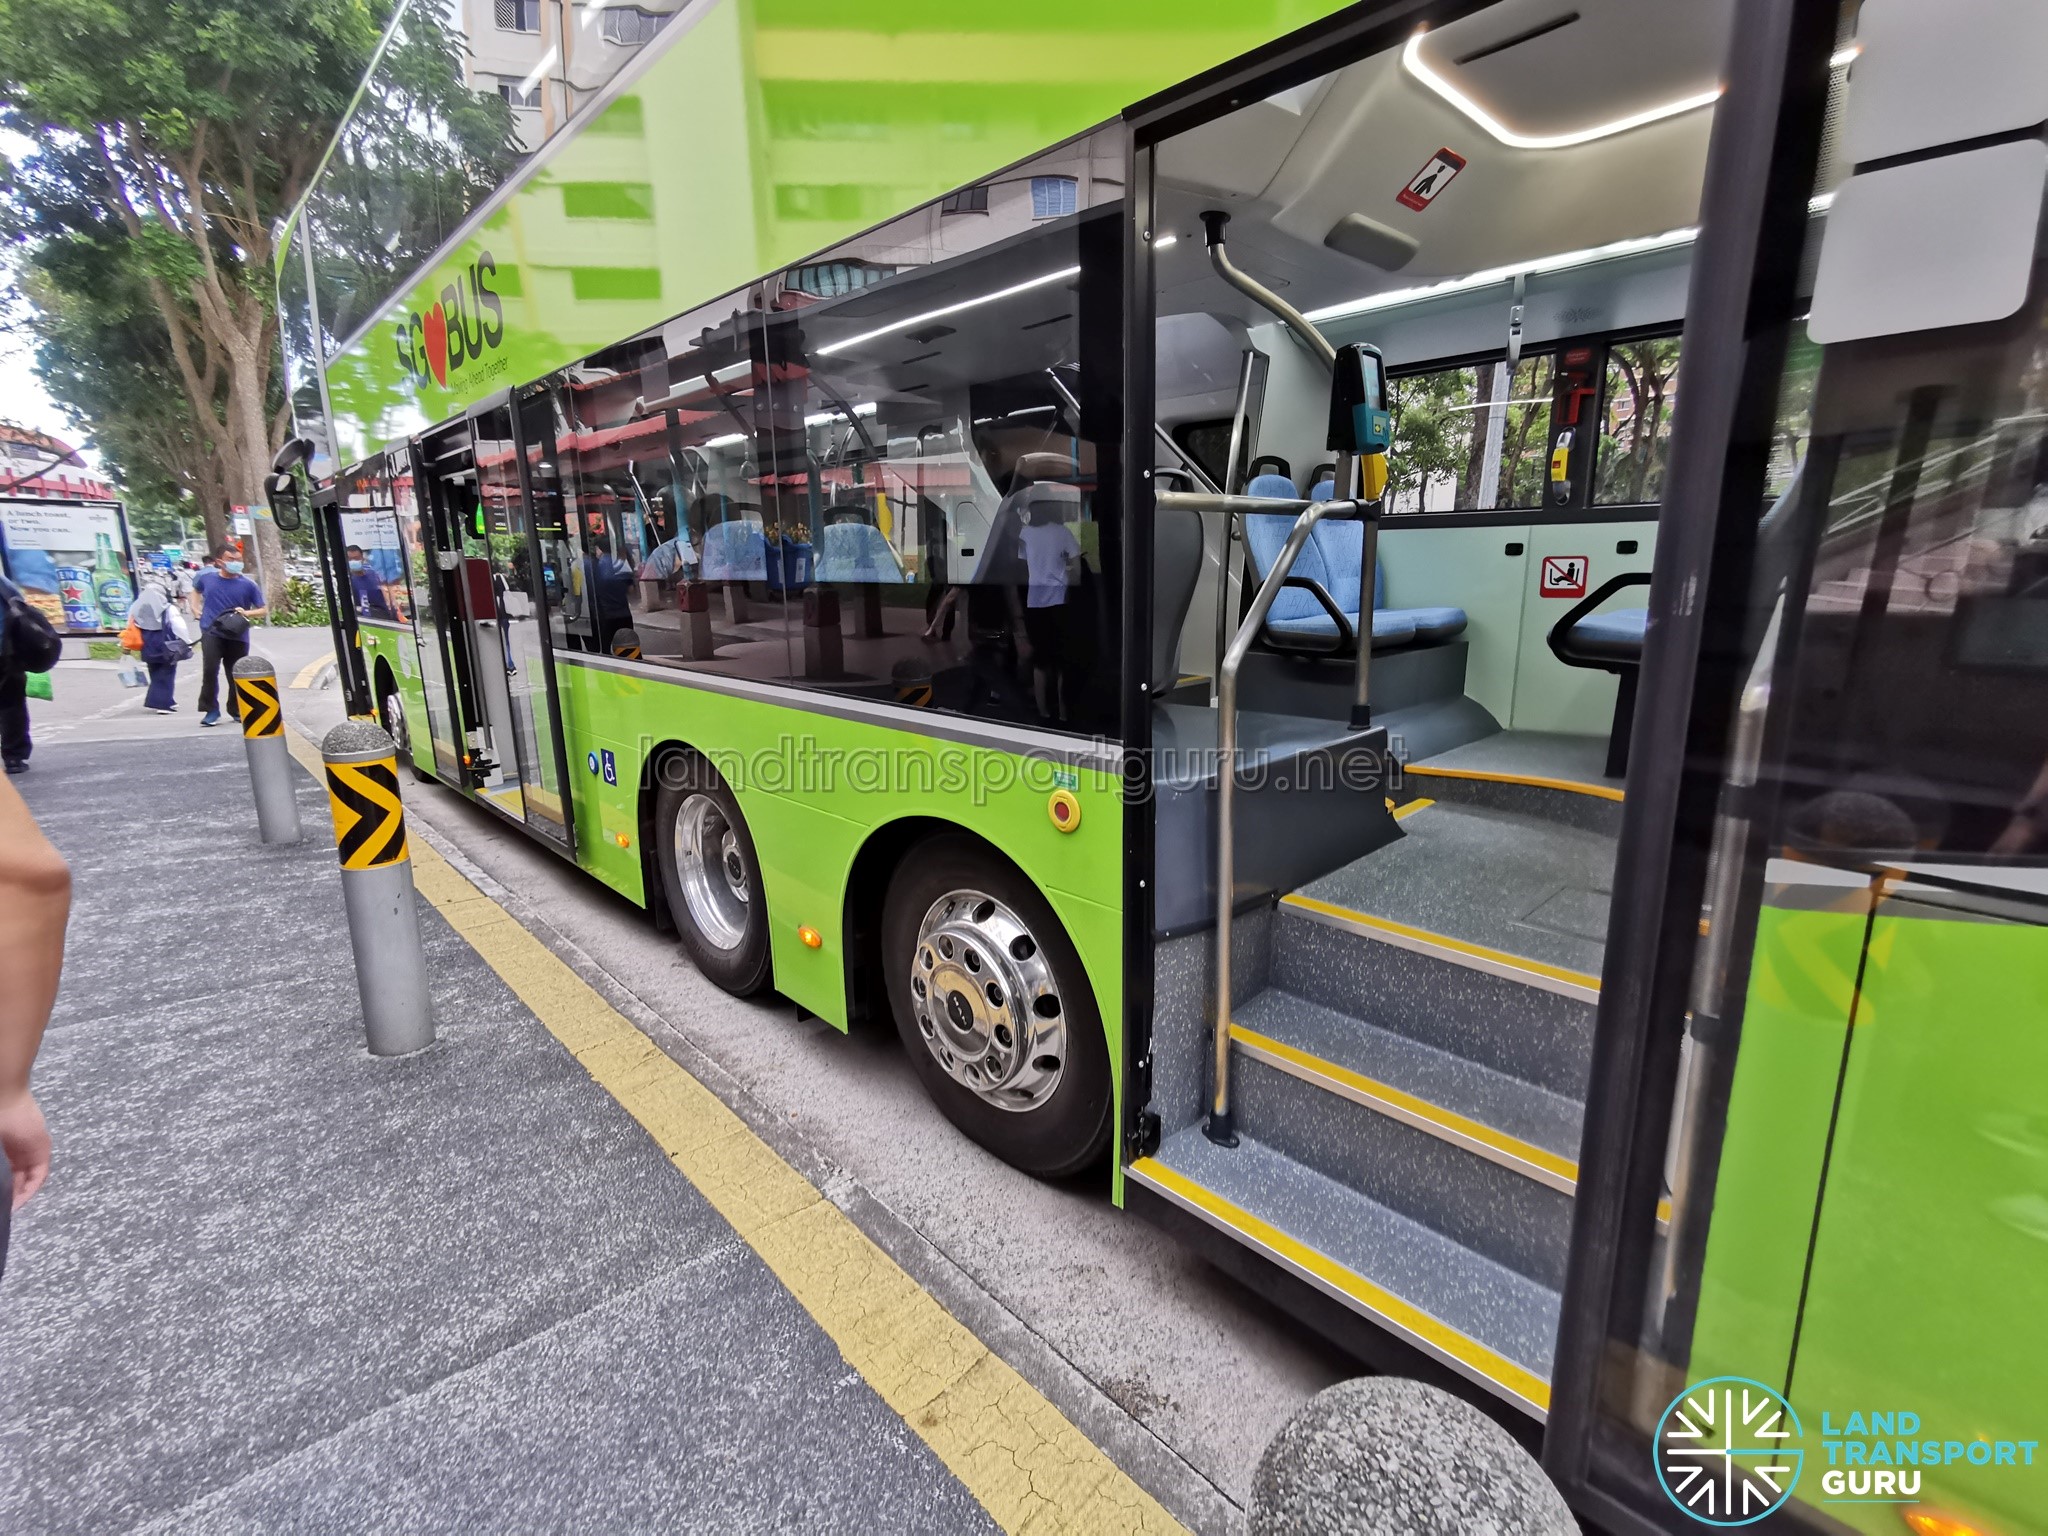
See: 3-Door Buses compared: ADL Enviro500 and MAN A95 | Land Transport Guru
3-door single-deck buses sacrificing seats
These buses trade seating capacity for a third door, drawing complaints about insufficient seats on longer routes.
Furthermore, the third door itself doesn’t always open, staying shut at stops LTA judges unsafe (too short, no proper platform, opening onto grass or a live traffic lane), forcing passengers to alight via the second door regardless.
Mid-delivery modification to BYD and Zhongtong buses
After complaints that priority seats on new buses were hard for elderly passengers to reach, LTA modified BYD BC12A04 and Zhongtong LCK6126EVG buses mid-delivery—altering the design partway through an active production run. Neither the cost of this change nor who ultimately bears it has been disclosed — this could be LTA, the manufacturer under warranty terms, or some other arrangement.
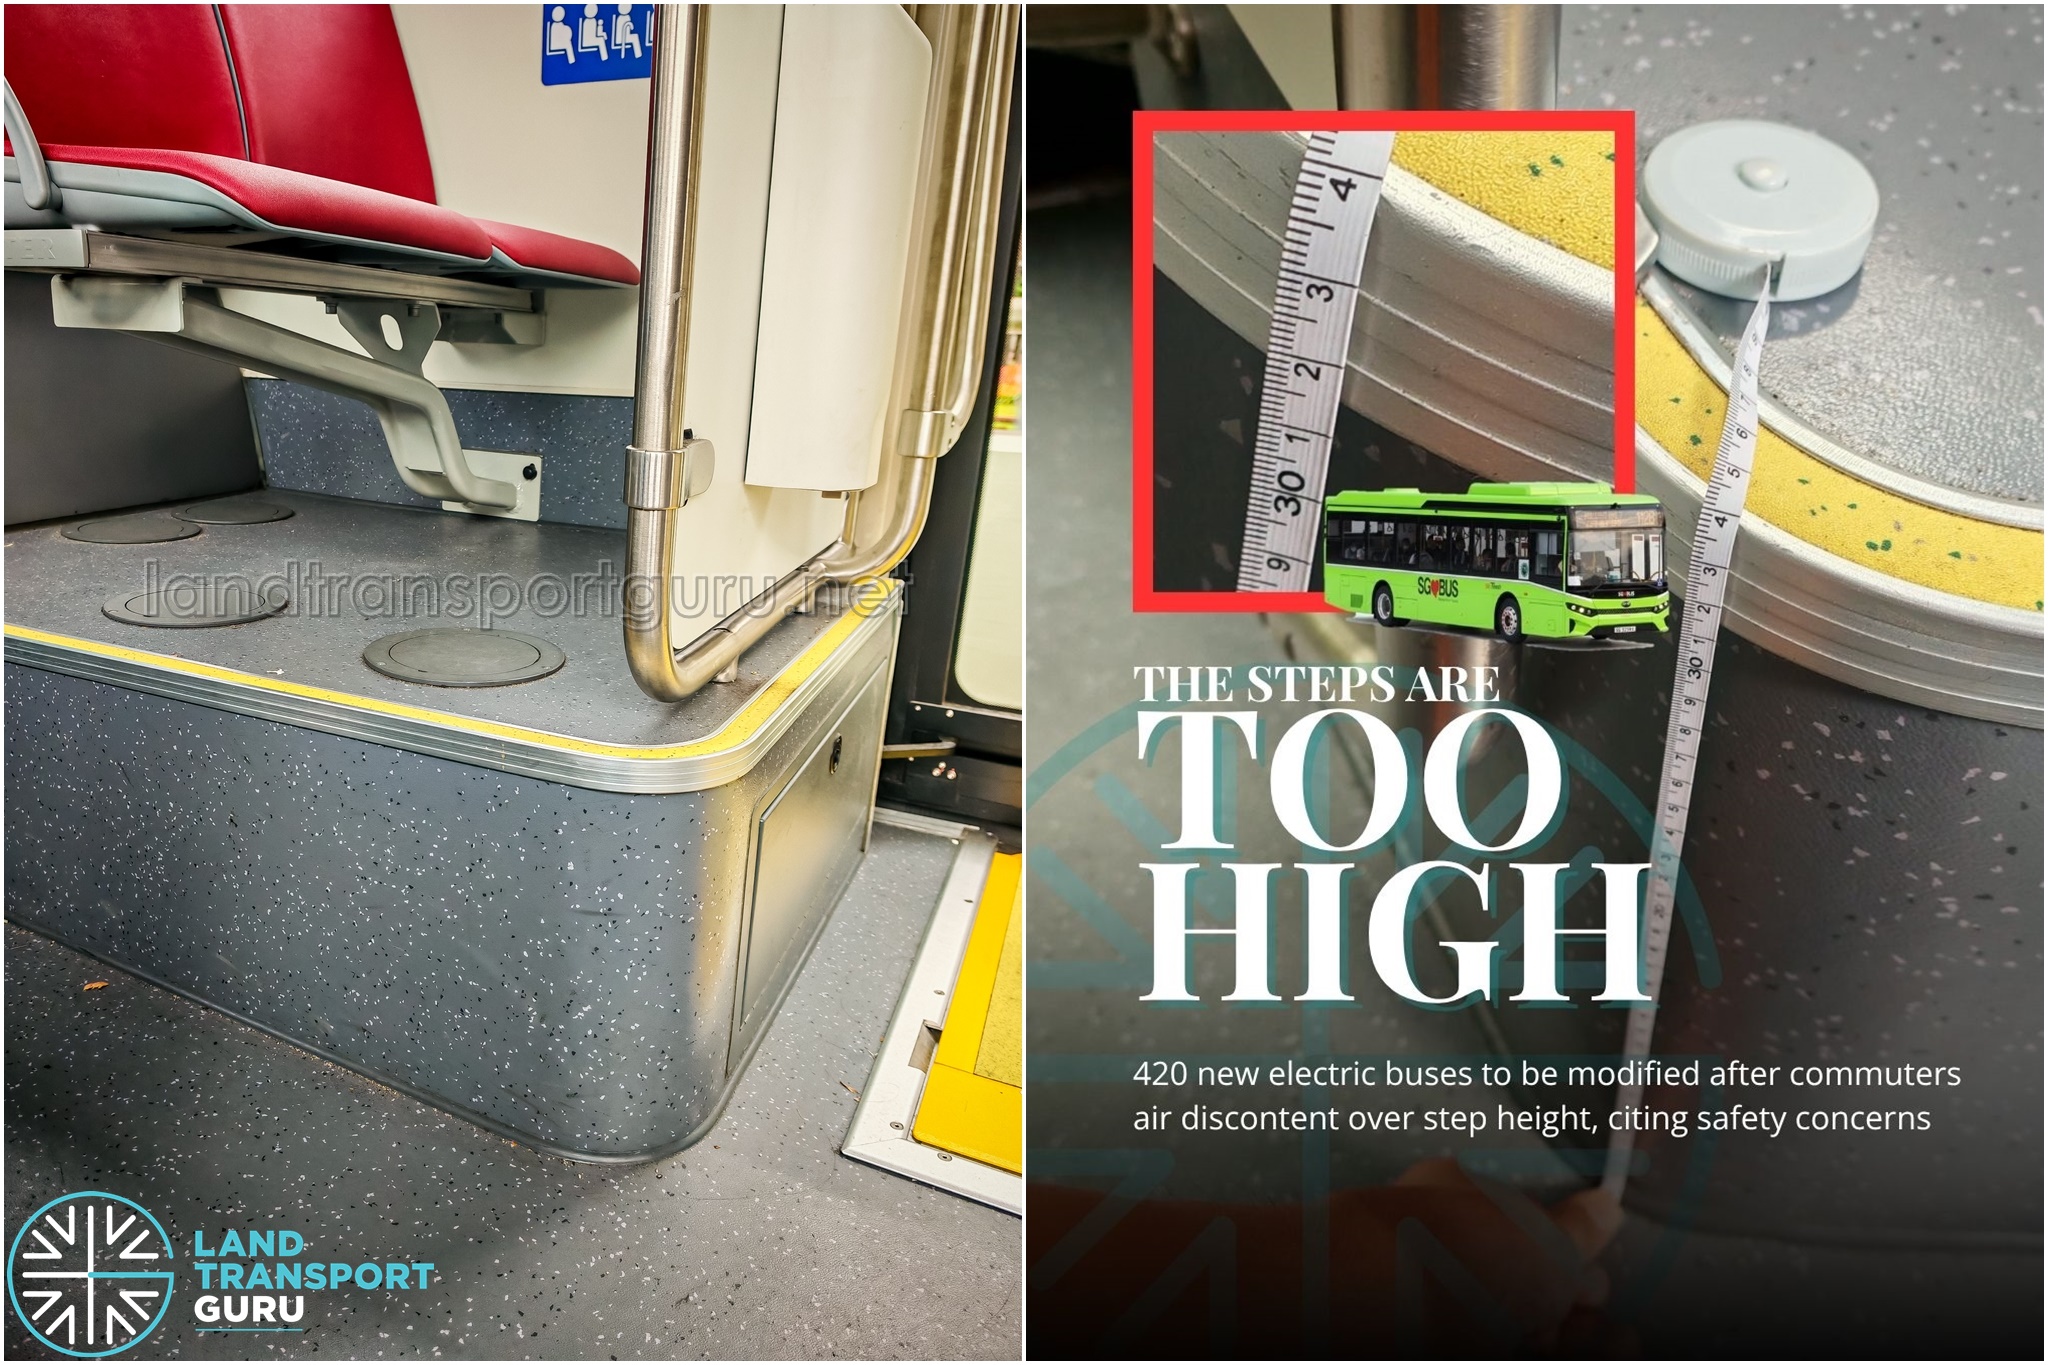
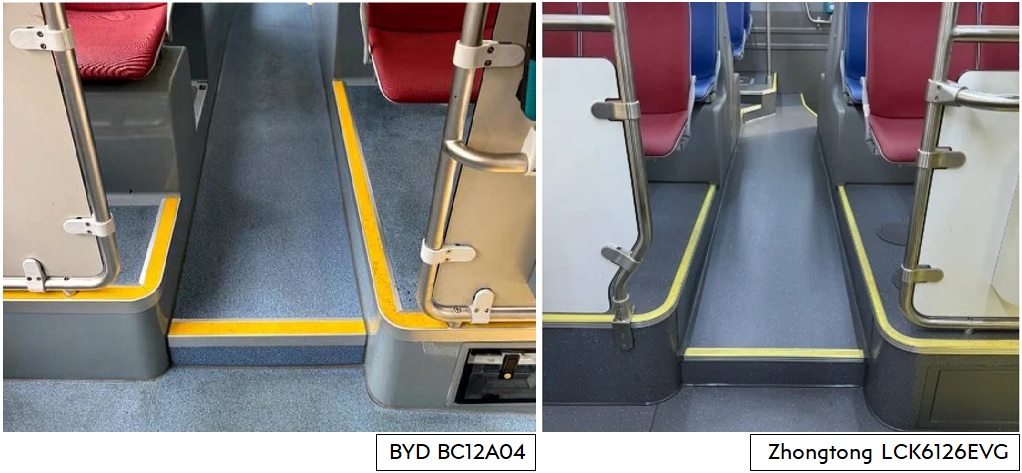
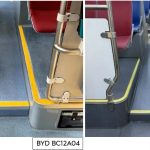
This is worth highlighting as its own gap rather than assuming a figure or a liable party: another instance of the transparency pattern running through this piece, this time in procurement rather than contract performance. Notably, this retrofit still doesn’t resolve the separate complaint about front wheelarch seats being mounted too high above the aisle.
Reversing course on full low-floor buses
LTA’s tender for 660 electric buses (Contract PT602) dropped the mandatory fully low-floor interior requirement, effectively reverting to allowing low-entry designs for the rear of the bus.
While these procurement missteps may seem minor, their collective impact challenges the assumption that centralised procurement is entirely positive. A single poor decision by a central authority affects the entire fleet simultaneously, leaving passengers and operators with no alternatives. Centralised decision-making on the procurement front by the LTA has evidently produced mixed results, and it remains a single point of failure without effective means to correct or buffer against poor choices.
Manpower: where competition alone wasn’t enough
The bus industry’s workforce challenges have become increasingly visible over the past decade, as the entire sector faces a genuine labour crunch.
Workforce costs are a direct test of whether BCM’s contracting model is financially sustainable. If an operator wins a package on an aggressive cost structure but then has to raise wages substantially to retain staff, someone absorbs that gap: either the operator, through thinner margins, or the workforce, through worse conditions. Authorities initially hoped that the BCM inter-operator competition alone would raise employment conditions [Link]. A decade later, the evidence suggests that theory needed reinforcement from direct Government intervention to actually work.
Local bus captains: an early win that’s since reversed
In 2017, MOT reported the number of Singaporean bus captains had risen from about 2,400 to 3,000, as operators competed for workers through better pay and conditions — a genuine early BCM success. Tower Transit even boasted of its strong Singaporean core, with 77% of its Bus Captains being Singapore citizens or Permanent Residents (PRs).
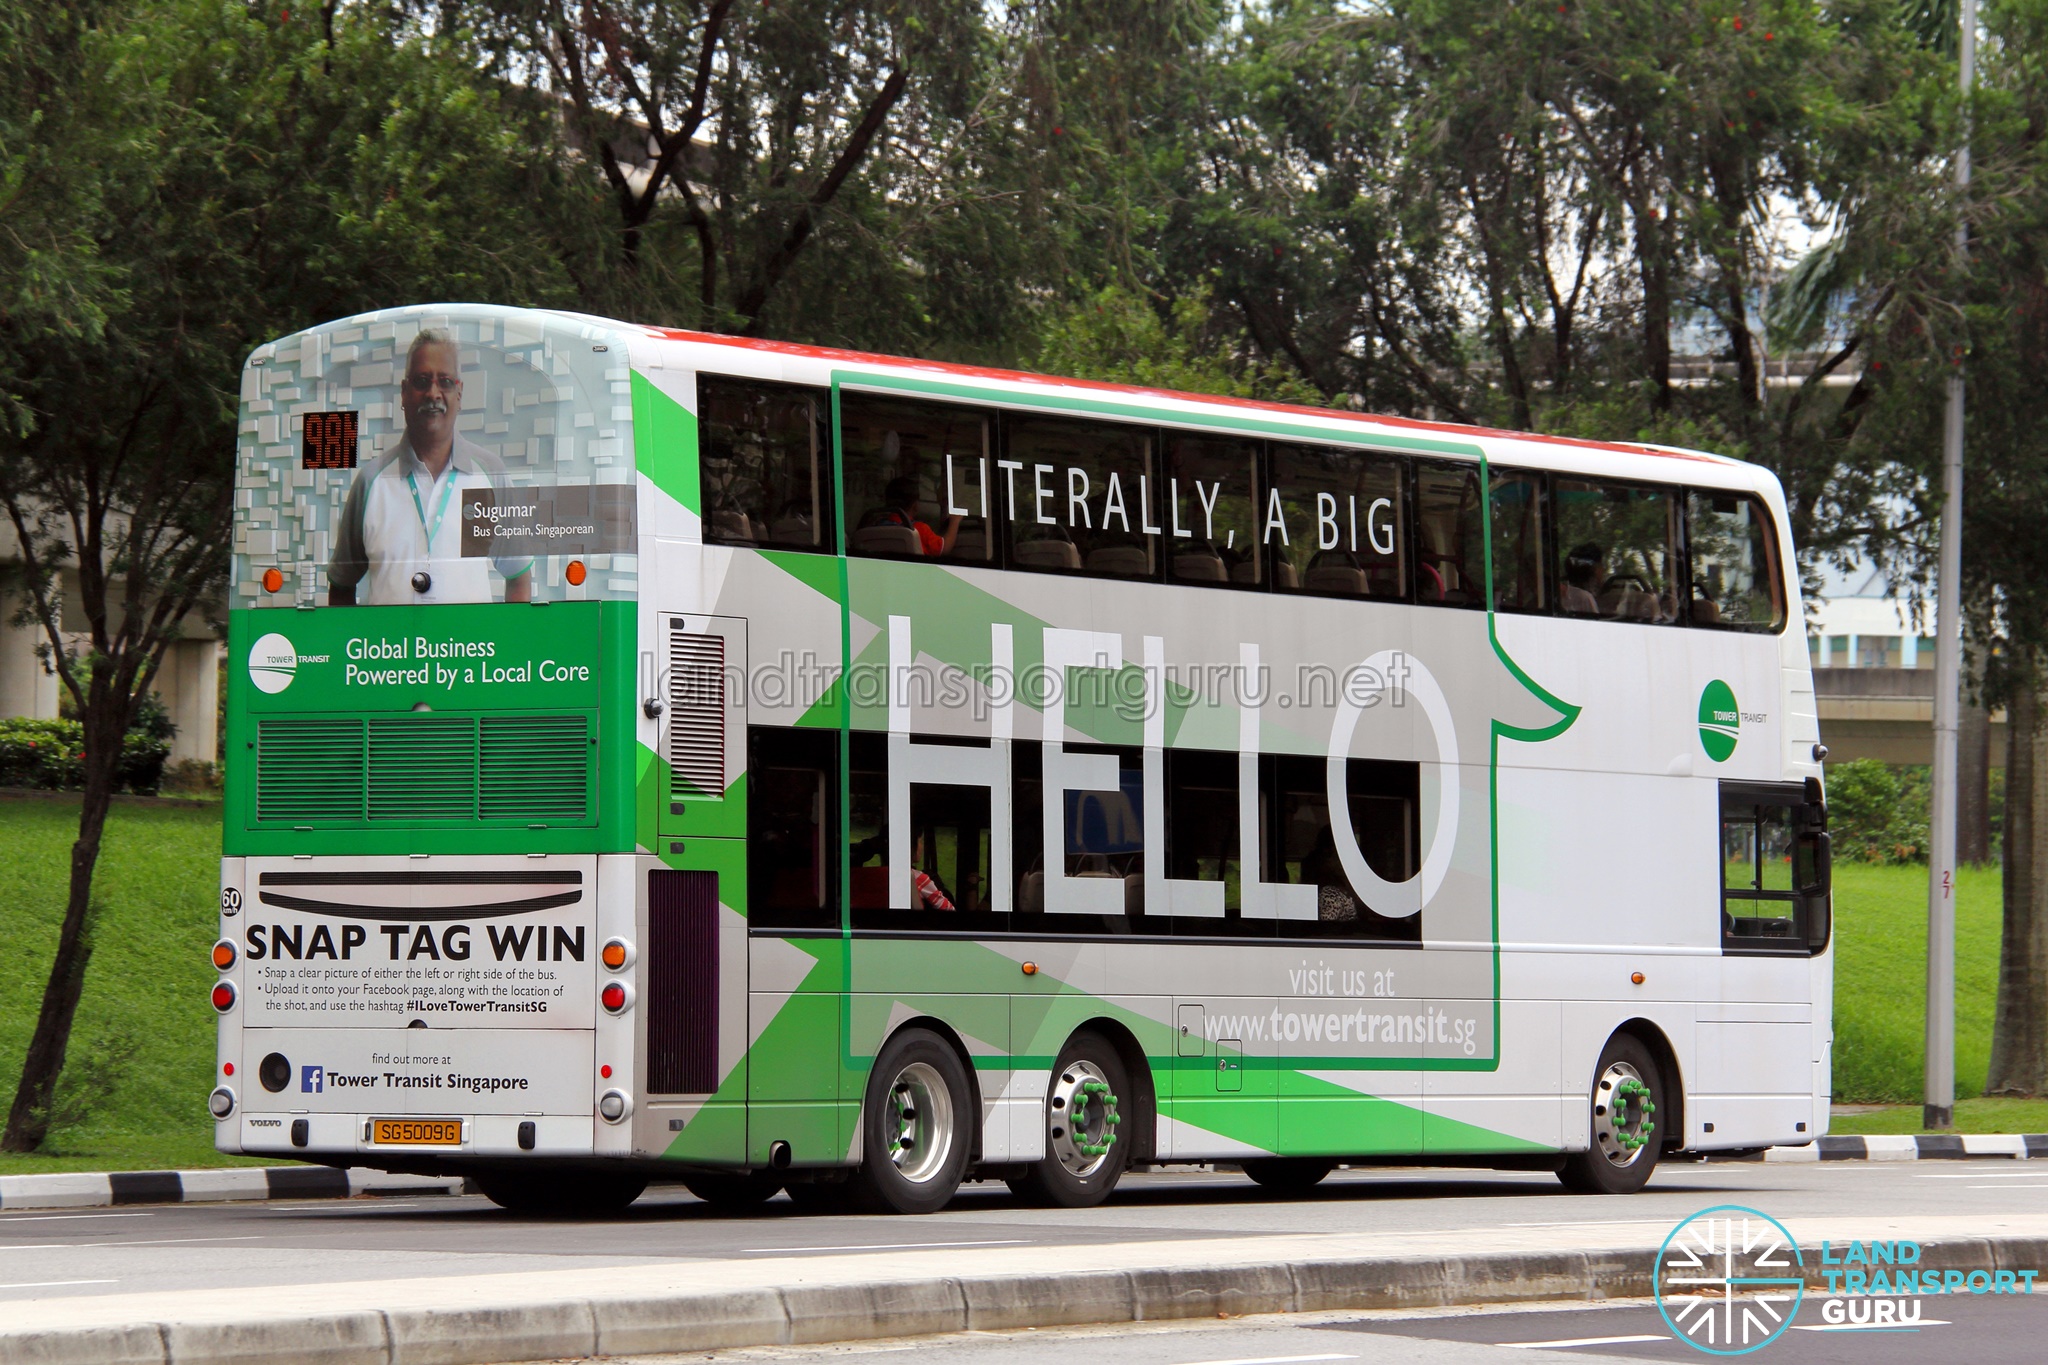
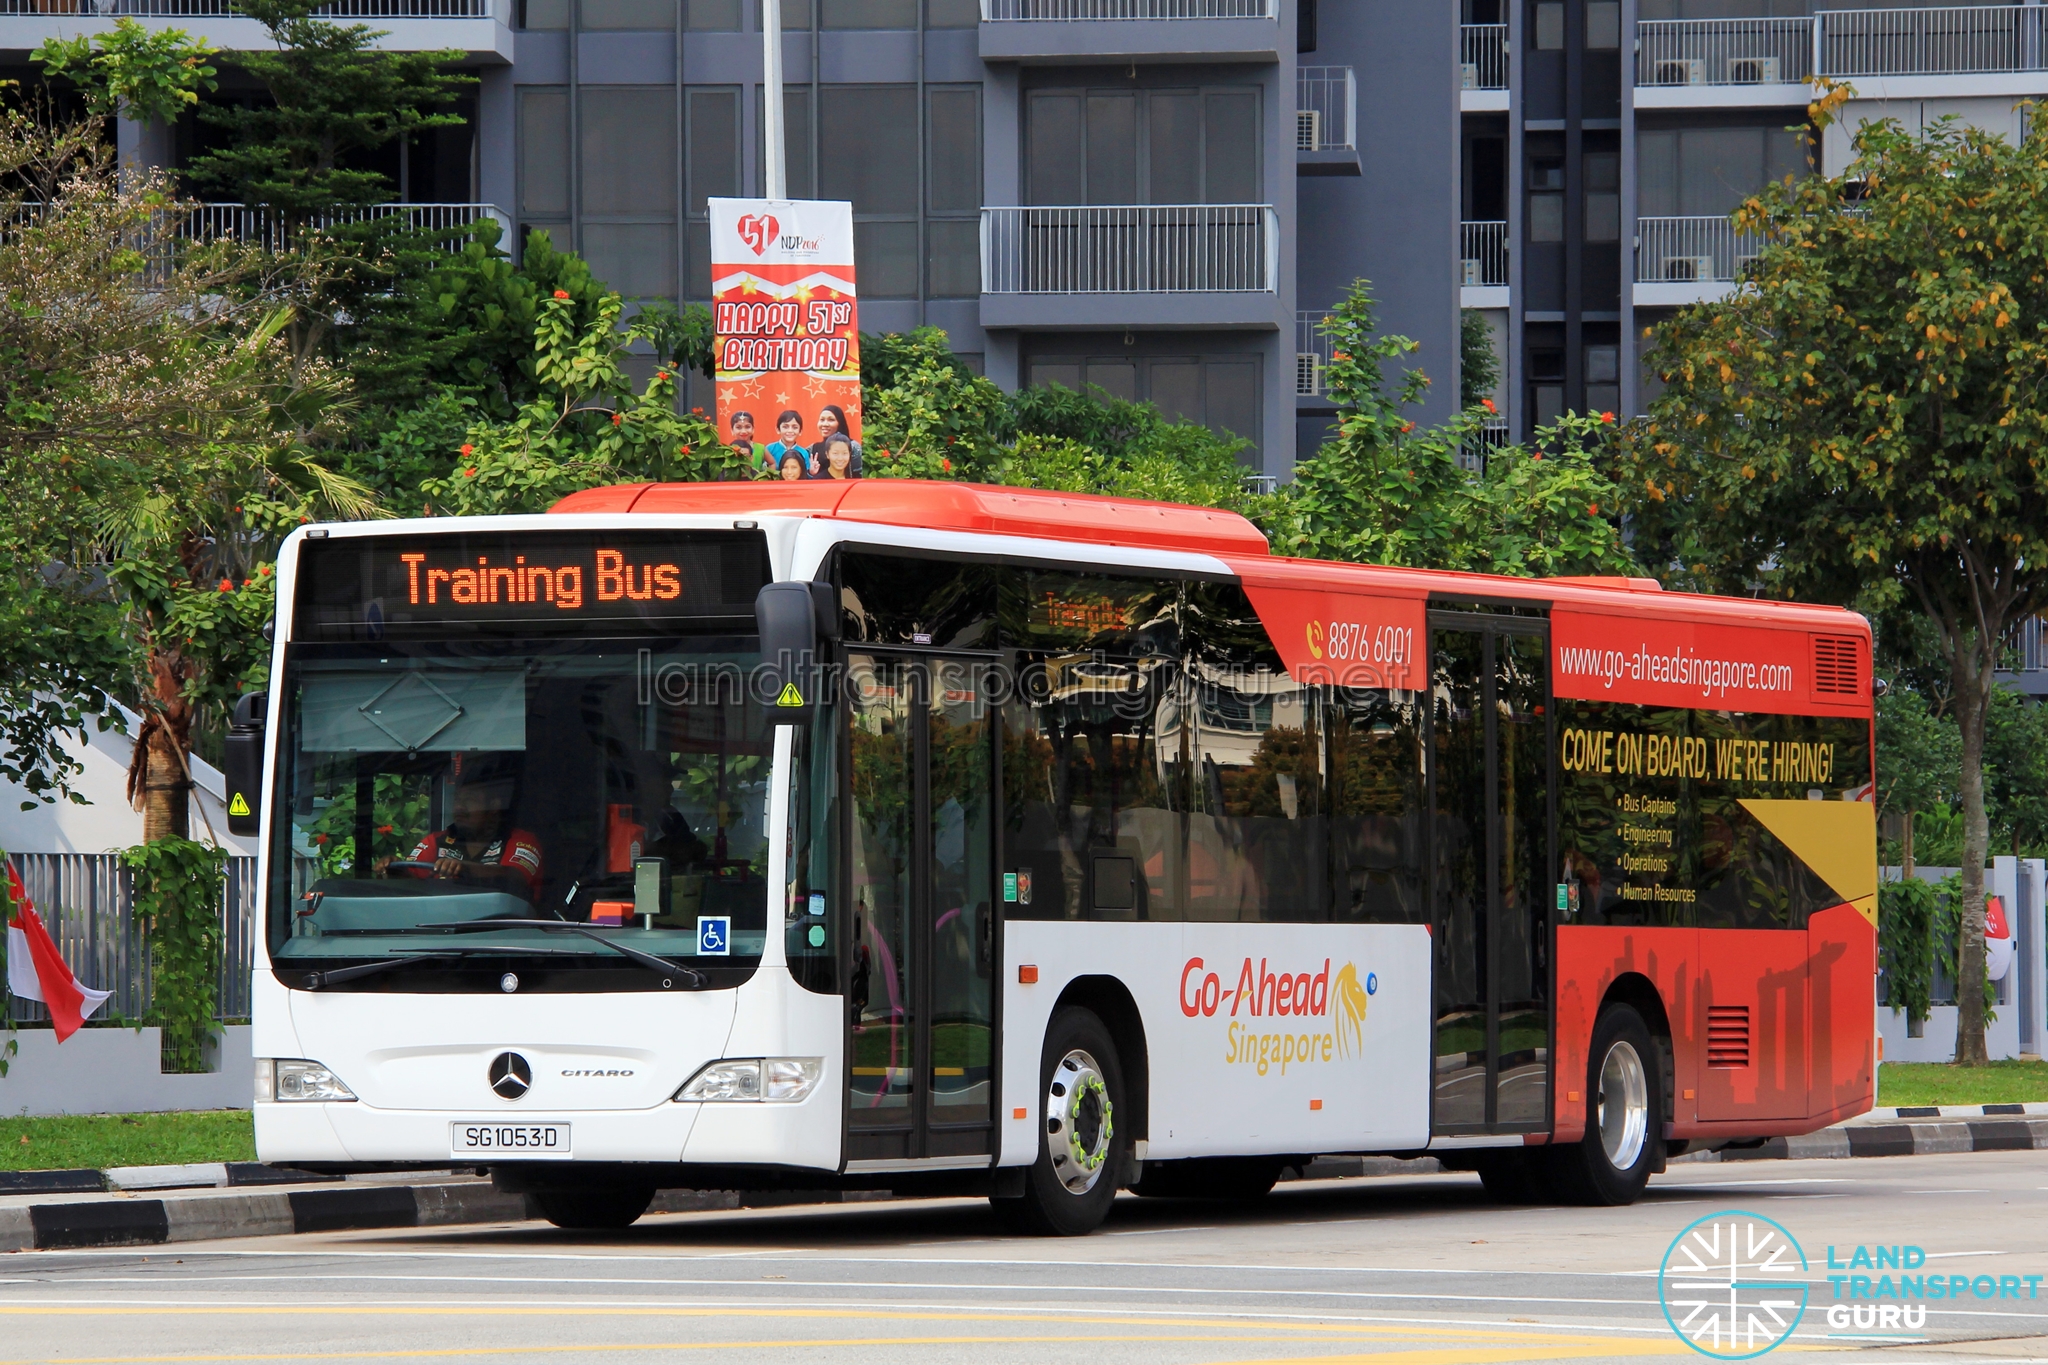
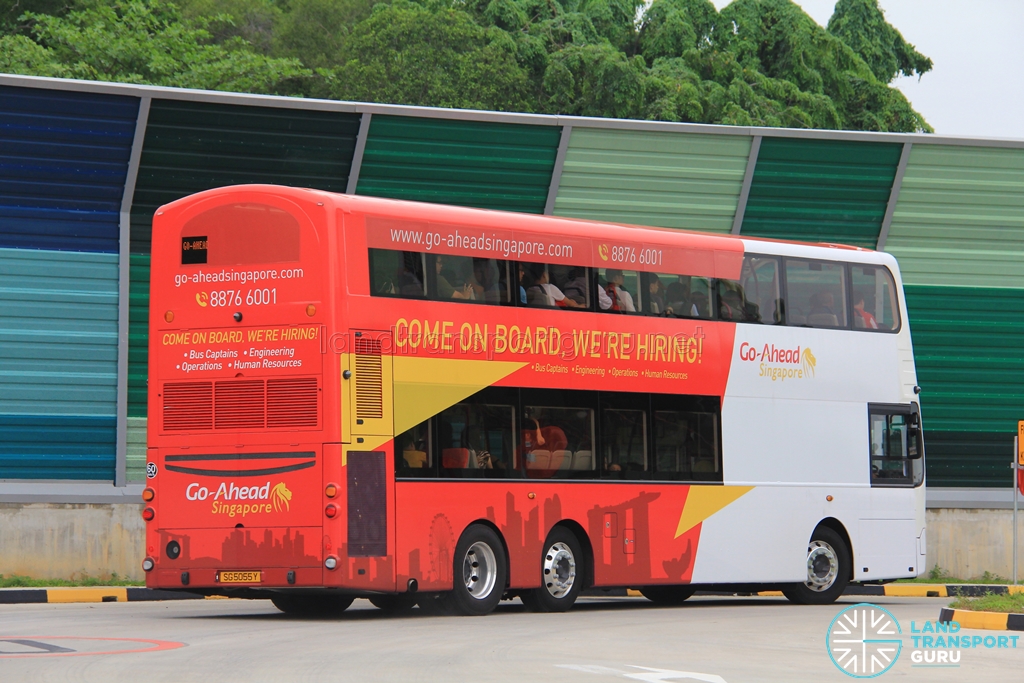
The total bus captain headcount has grown modestly — about 9%, from roughly 8,900 in 2015 to 9,700 in 2024 — but the composition has shifted markedly. LTA reported that the proportion of local bus captains fell from 54% in 2021 to 41% in 2025, with two bus captains leaving through resignation or retirement for every one recruited. As of December 2024, Singaporeans made up around 28% of bus captains, Permanent Residents 15%, and foreign work pass holders 57%. [Link]
Operators have raised pay and perks — but it still wasn’t enough
Under BCM’s competitive pressure, all four operators have raised salaries and benefits. This started in the months before September 2016 as new entrants Tower Transit and Go-Ahead offered sign-up bonuses and higher basic wages to attract bus captains, along with benefits like free public transport, flexible benefits, and relieving BCs of the need to garage and clean buses within the depot. In early 2016, both Tower Transit and Go-Ahead offered basic starting wages of $1,865 a month, up to 15 per cent higher than existing bus operators SBS Transit and SMRT Buses at the time.
Mid-2016 saw a quick succession of BC salary increases for Singaporeans and permanent residents. Tower Transit and Go-Ahead raised their starting pay to $1,930 and $1,950 per month, in May and July respectively. [Link][Link] In June, SBS Transit raised starting pay to $1,950, up more than 9 per cent from $1,775 previously. [Link] Just over a year later, in July 2017, Tower Transit increased starting salaries to S$2,002, past the $2k mark for the first time. [Link]

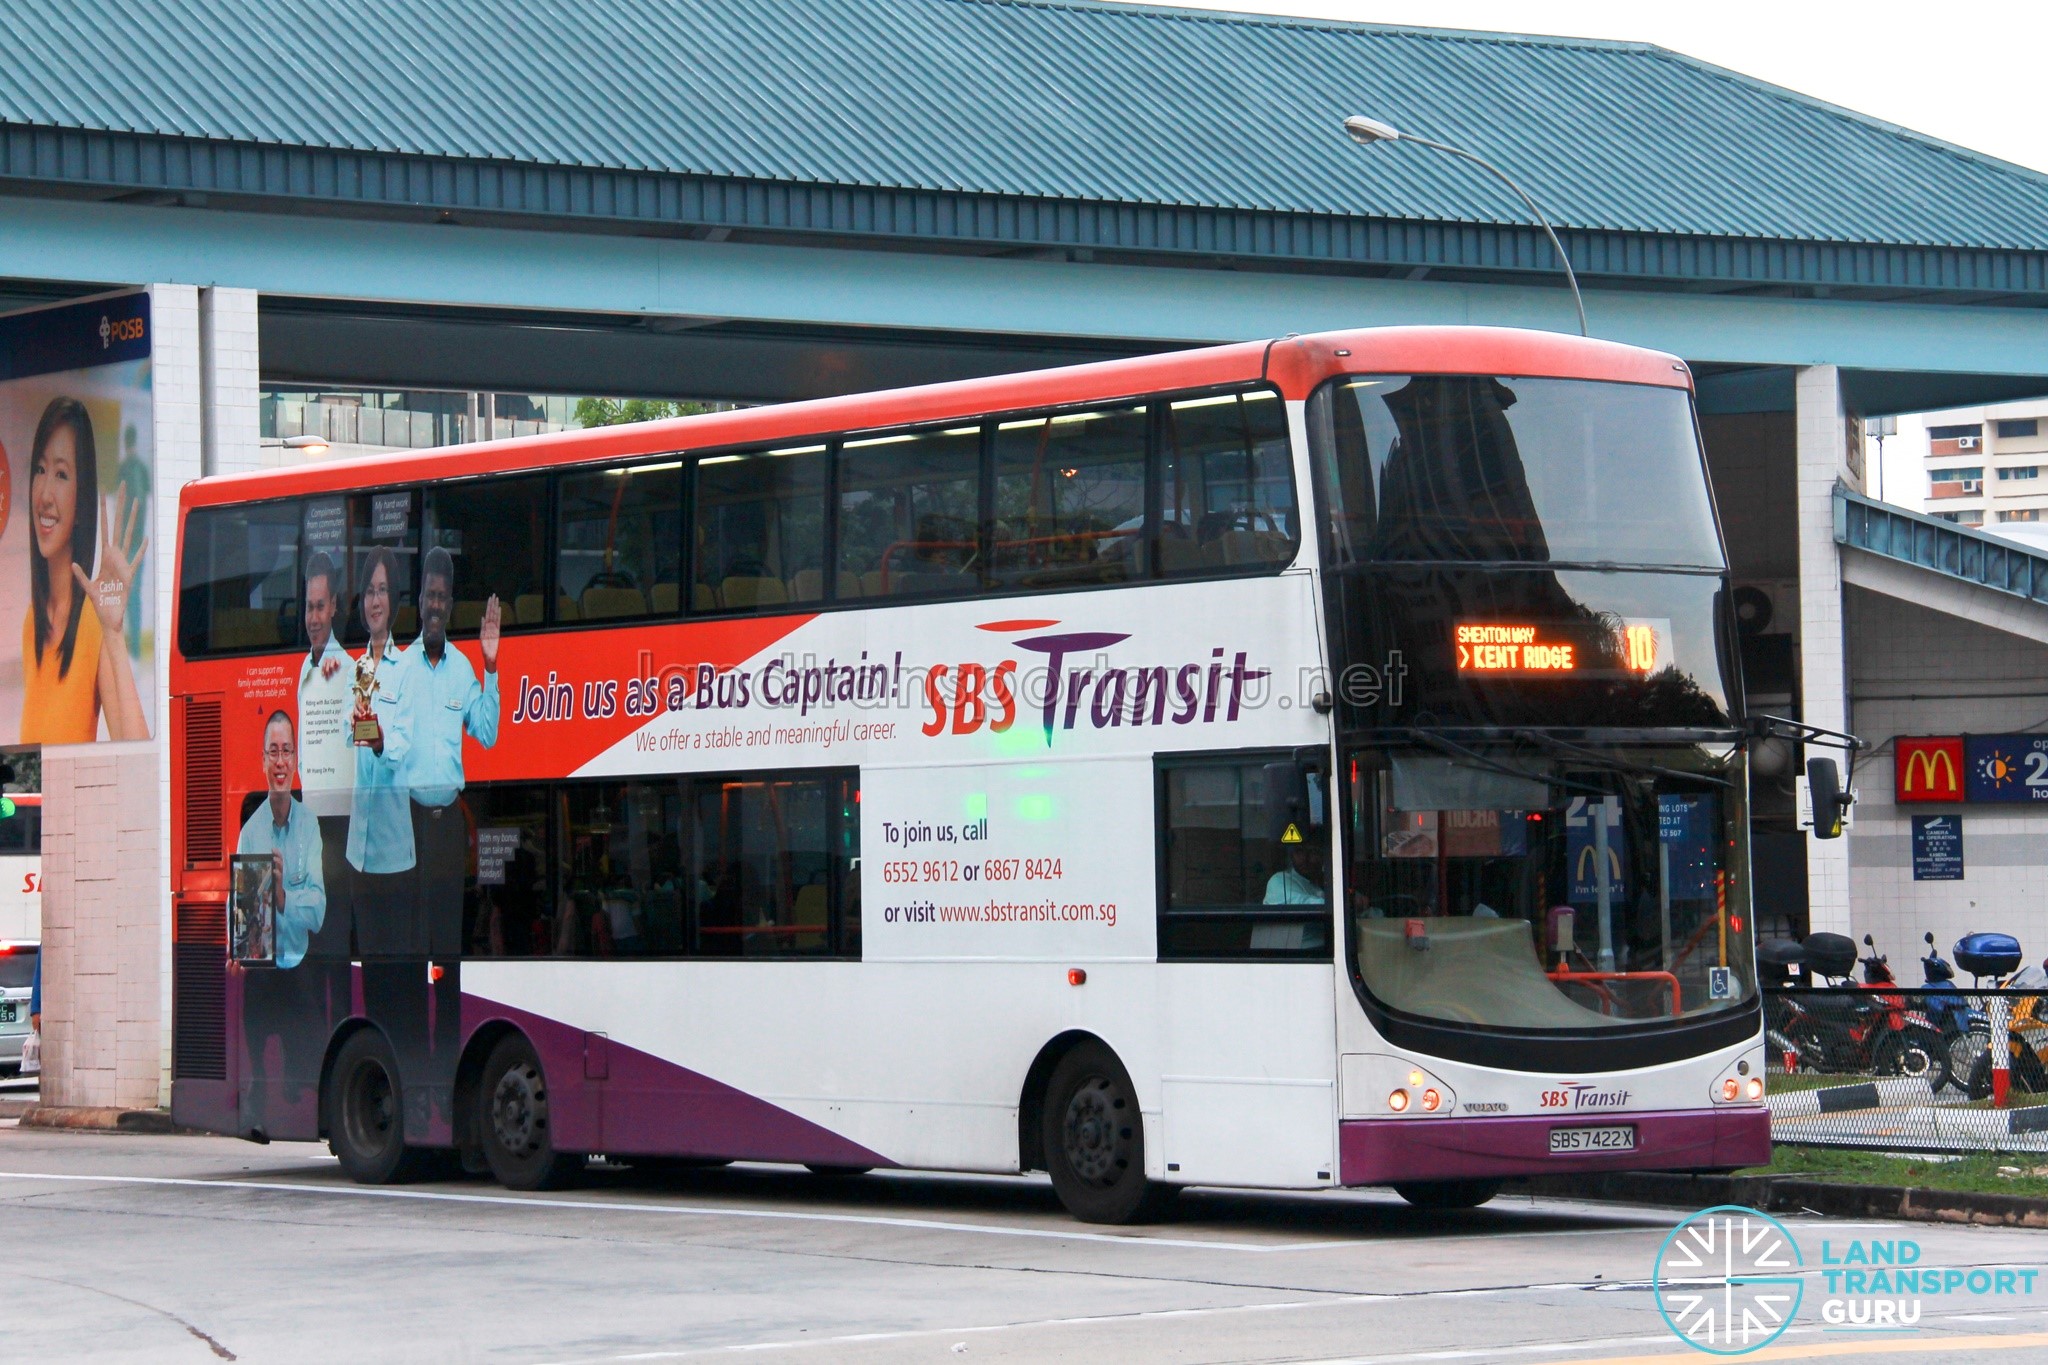
Nearly a decade later, in 2025, all four PTOs offer basic salaries of between $2,250 and $2,360. SBS Transit, SMRT and Go-Ahead Singapore offer sign-on bonuses of up to S$20,000 for Singaporean and PR applicants; Tower Transit offers S$7,200 for new-to-industry applicants; SBS Transit adds S$1,000 for successful referrals. All four now offer flexible work arrangements, and several offer targeted support — SBS Transit and Go-Ahead both offer childcare-cost benefits for drivers with young children. [Link]
Wellness and retention perks have also become part of how operators compete for staff, with some offering benefits beyond the standard healthcare and workplace provisions. Tower Transit, for example, provides express massages at its depots and interchanges, weekly fitness classes, health talks and other wellness activities through its TowerCARE programme. Go-Ahead Singapore has also previously differentiated its employment package through a flexible annual allowance that bus captains could use on health, wellness, learning and leisure programmes. All four operators also cite career progression and development pathways as retention tools.
None of these measures has fully solved the shortage. In June 2026, the Government stepped in directly — funding a S$450 monthly salary increase for new Singaporean and Permanent Resident (PR) bus drivers from January 2027, plus an additional S$2,000 sign-on bonus, lifting average new-driver pay (with overtime and allowances) from around S$3,600 to over S$4,000 [Link]. Existing drivers get a one-time S$150–250 increase, this time funded by the operators themselves.
These developments reveal that BCM’s early successes — in which operator competition would be sufficient to fix bus captain recruitment and retention — could not be sustained. A decade later, it took a direct, government-funded wage subsidy (announced outside the BCM mechanism entirely) to move the needle, alongside LTA’s adoption of the Bus Safety Tripartite Taskforce’s recommendations on driver welfare. That’s not a condemnation of BCM so much as a clear-eyed acknowledgement that the model’s built-in incentives had reached their limit and needed a backstop.
Two details are worth flagging rather than glossing over, and both extend the transparency thread running through this piece. First, the Government has said the actual cost of the new-driver subsidy will depend on take-up rate — meaning there is no fixed, disclosed figure for what this intervention will cost taxpayers, only an open-ended commitment [Link]. Second, LTA and MOT have not explained how they secured the four operators’ agreement to fund the one-time raise for existing drivers themselves, out of their own margins under existing contracts — a genuinely interesting negotiation that happened entirely out of public view. The actual price tag and the mechanics of how operators were brought on board remain, like so much else in this piece, undisclosed.
BCM in service of LTA policy goals
One of the original arguments for BCM was that it would let LTA respond faster to changing travel demand. The Bus Connectivity Enhancement Programme (BCEP) effectively uses BCM mechanisms to quickly implement them: since its July 2024 launch, LTA reported by February 2026 that BCEP had introduced 27 new or extended bus services and enhanced 62 existing ones, benefiting roughly 244,000 commuters daily.
While this represents the kind of network responsiveness BCM was supposed to enable, the fact that LTA needed a dedicated, separately funded programme to deliver it also suggests something more modest than “BCM makes network planning easy” — it’s made the network easier to change, not easier to predict. Anticipating where new demand will emerge remains a hard problem regardless of the contracting model underneath it.
BCM as a cross-subsidy for rail
City Direct Services are a clear example of LTA using its centralised control to pursue policy goals. These routes cost roughly 1.5 times more to run than standard trunk services as they are built around point-to-point travel during a narrow one-way peak period. Buses run full for one to two hours each weekday morning (toward the CBD) and evening (back to residential estates), then sit largely idle for the rest of the day. LTA has partly offset this with an express-fare increase of up to 50 cents in 2025.
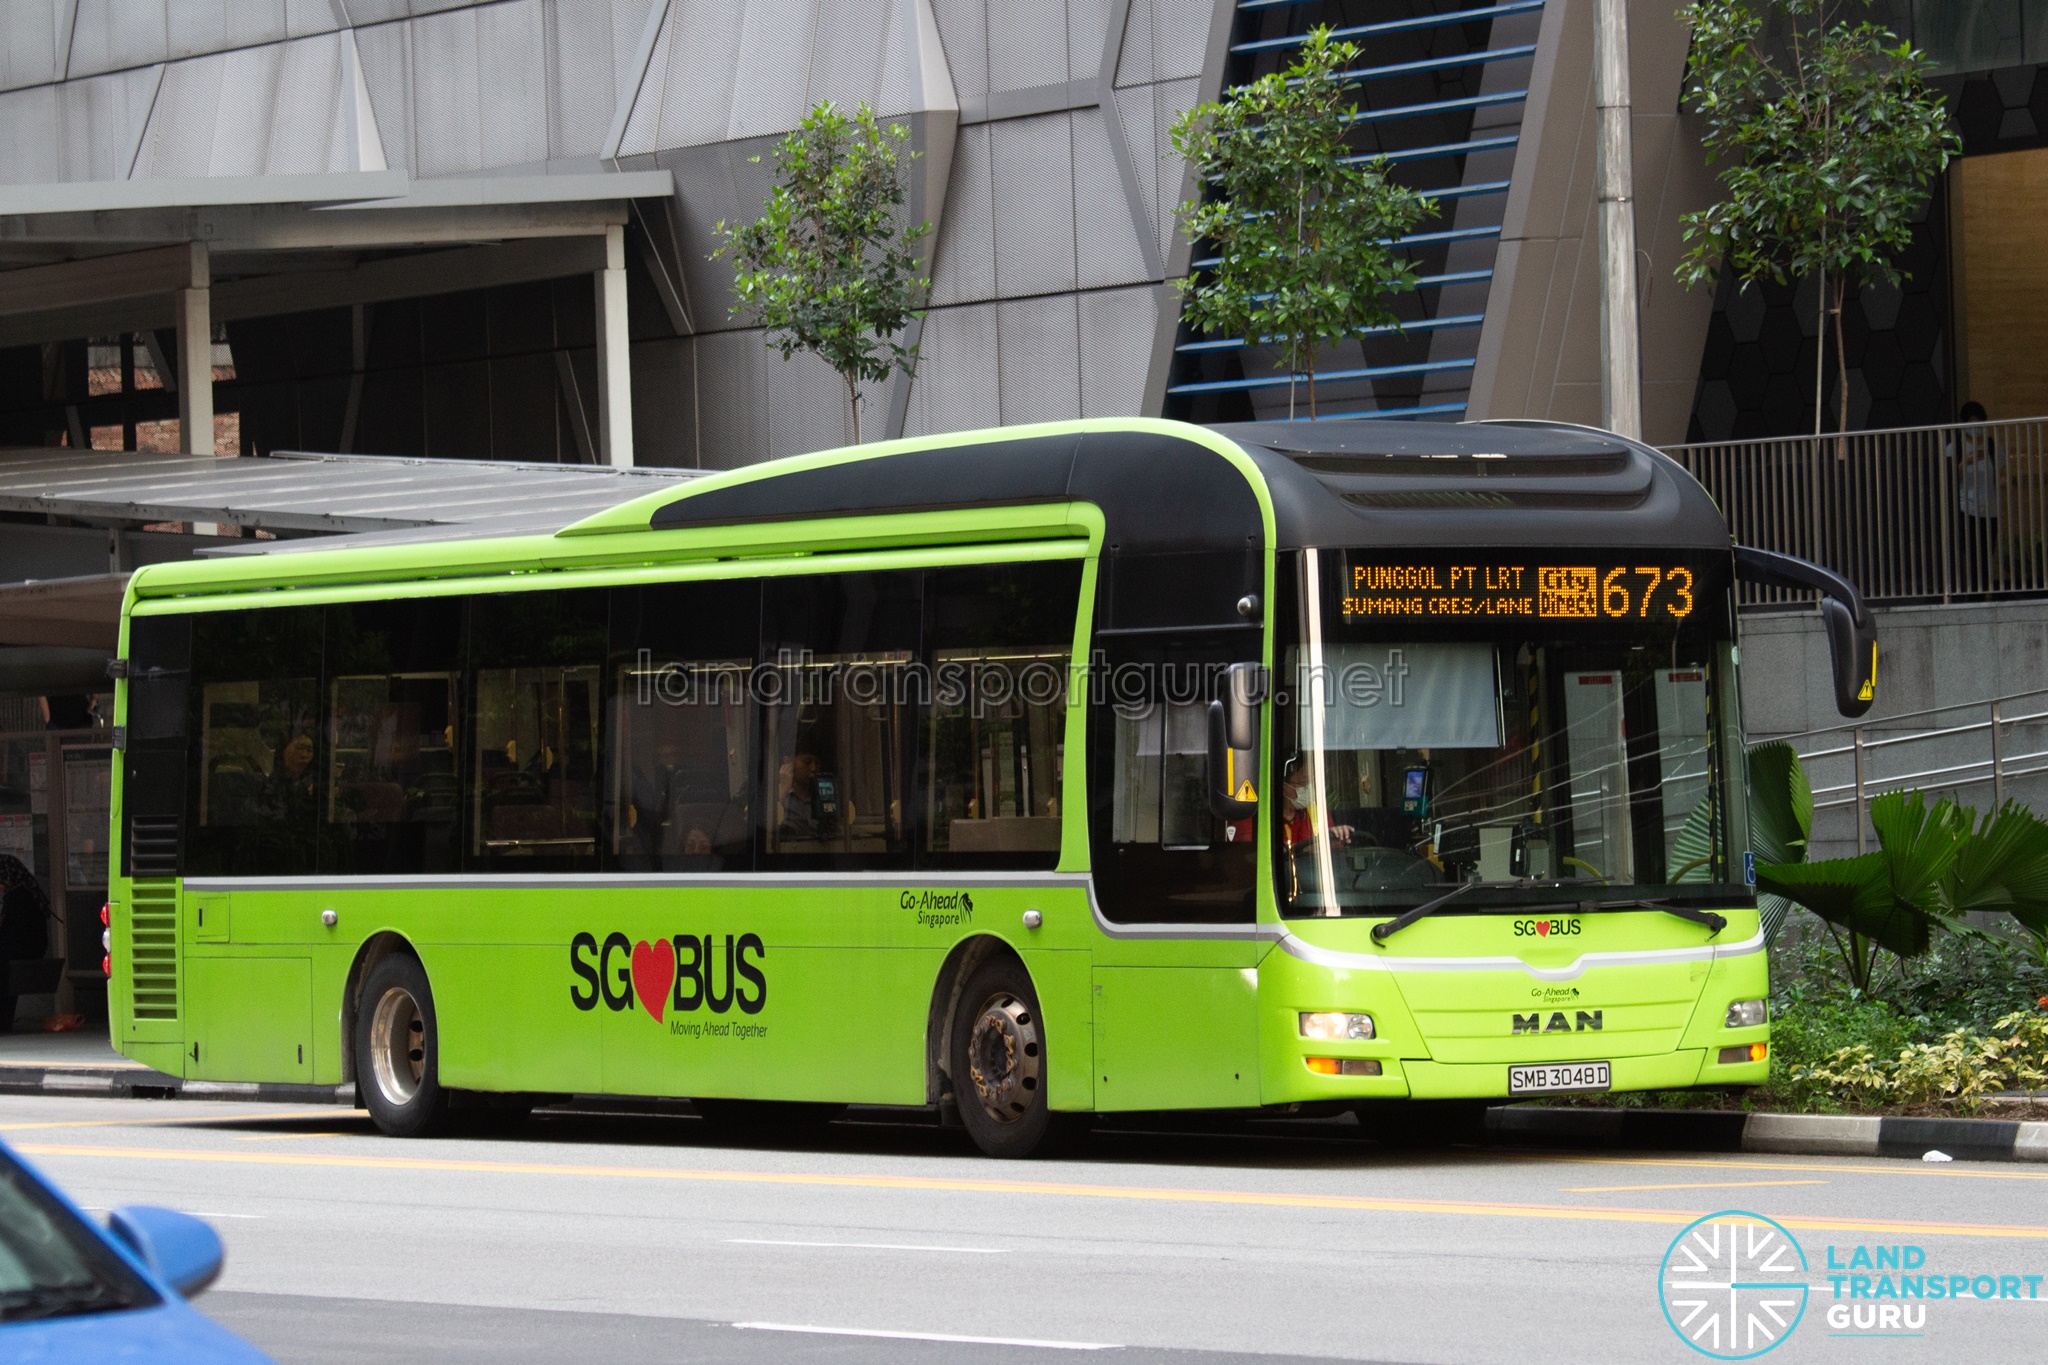
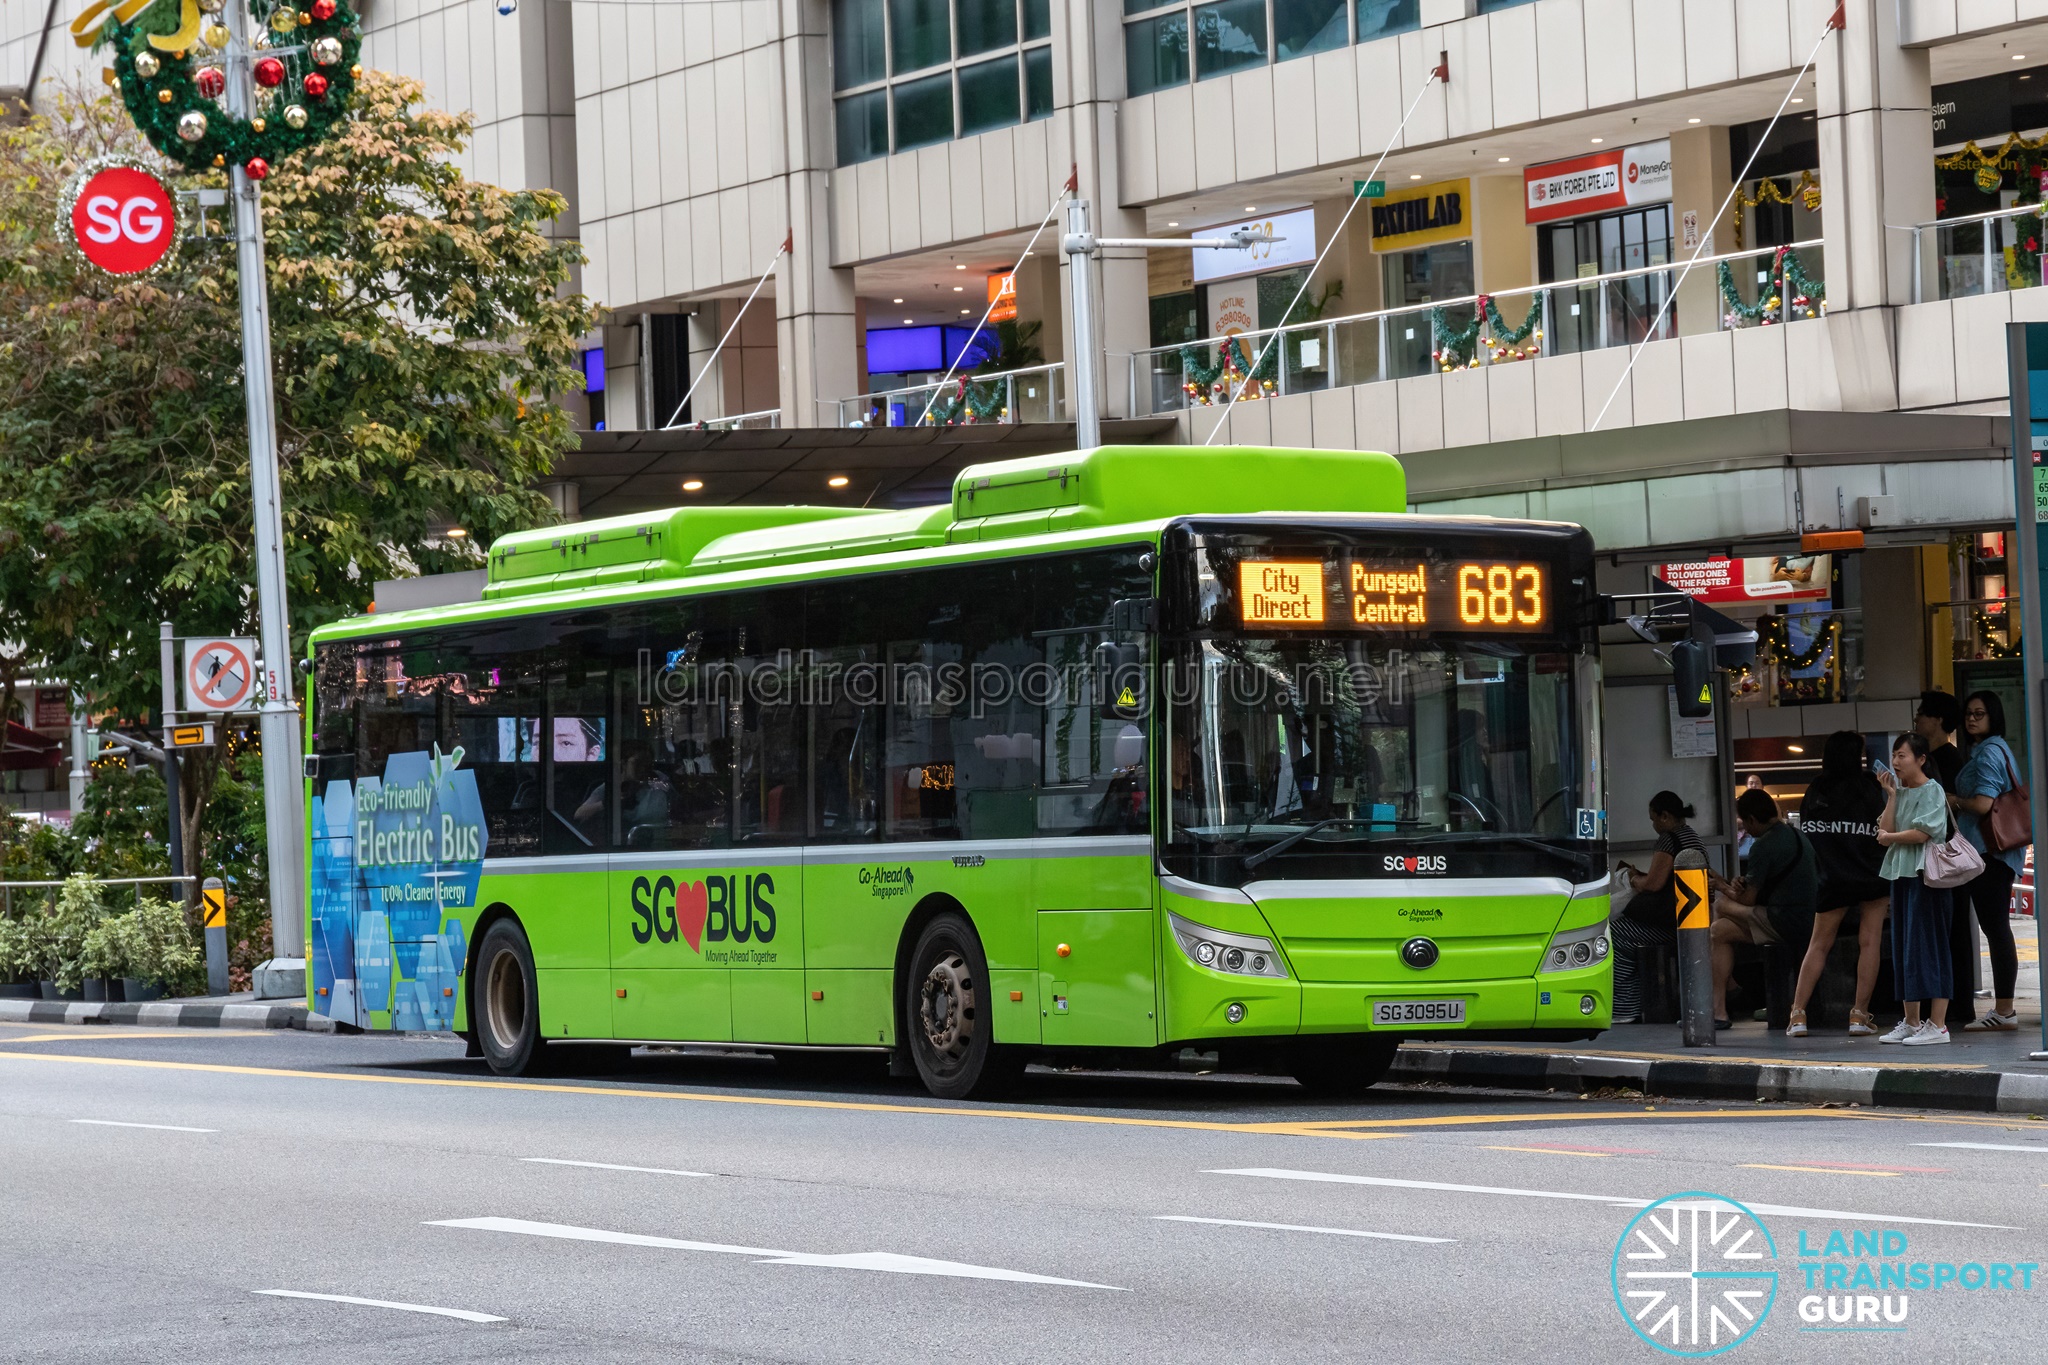
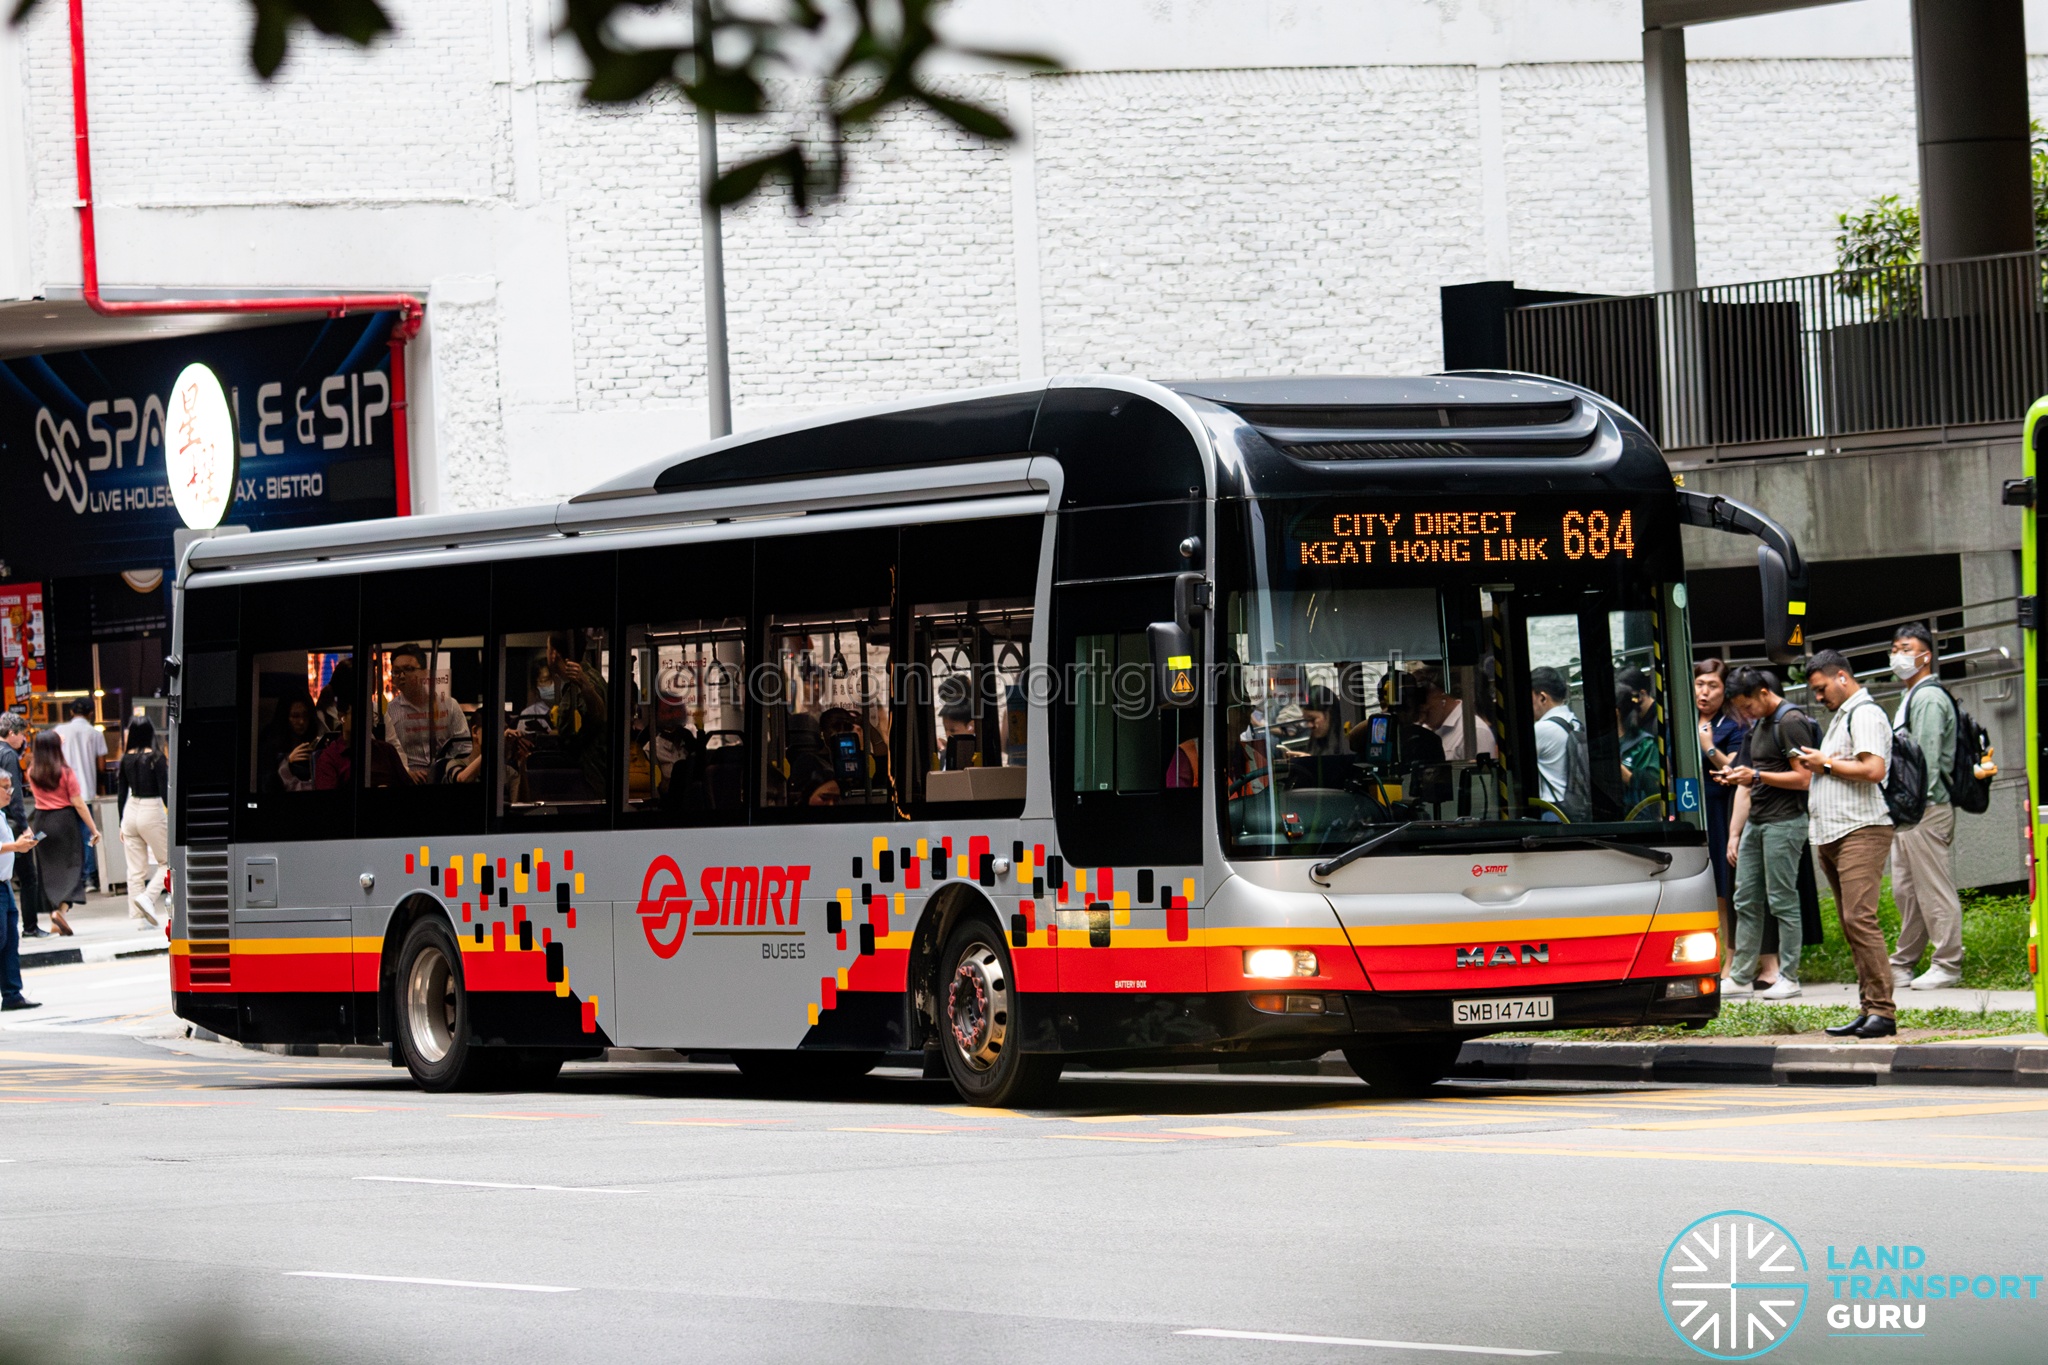
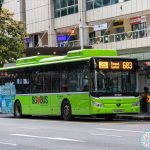
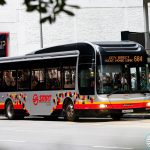
Under BCM, LTA can offer City Direct services from a network-strategy perspective rather than profitability. Charging express fares of ~S$3–3.50, these are lower than privately run Premium Bus Services, which remain fully commercial and charge accordingly (roughly S$3.50–5 flat fares), which arguably reflects the true cost of point-to-point service.
Despite the negative unit economics, LTA has kept expanding City Direct-style routes, including new services (City Direct 673–684) introduced under BCEP between October 2024 and June 2026. The stated justification isn’t route-level profitability but network-level value: these services pull meaningful ridership off congested MRT lines — the North East Line in particular — during peak periods, working alongside LTA’s Free Morning Off-Peak NEL Rail Rides and Travel Smart Journeys initiative, which separately encourages commuters to shift rail trips outside the peak.
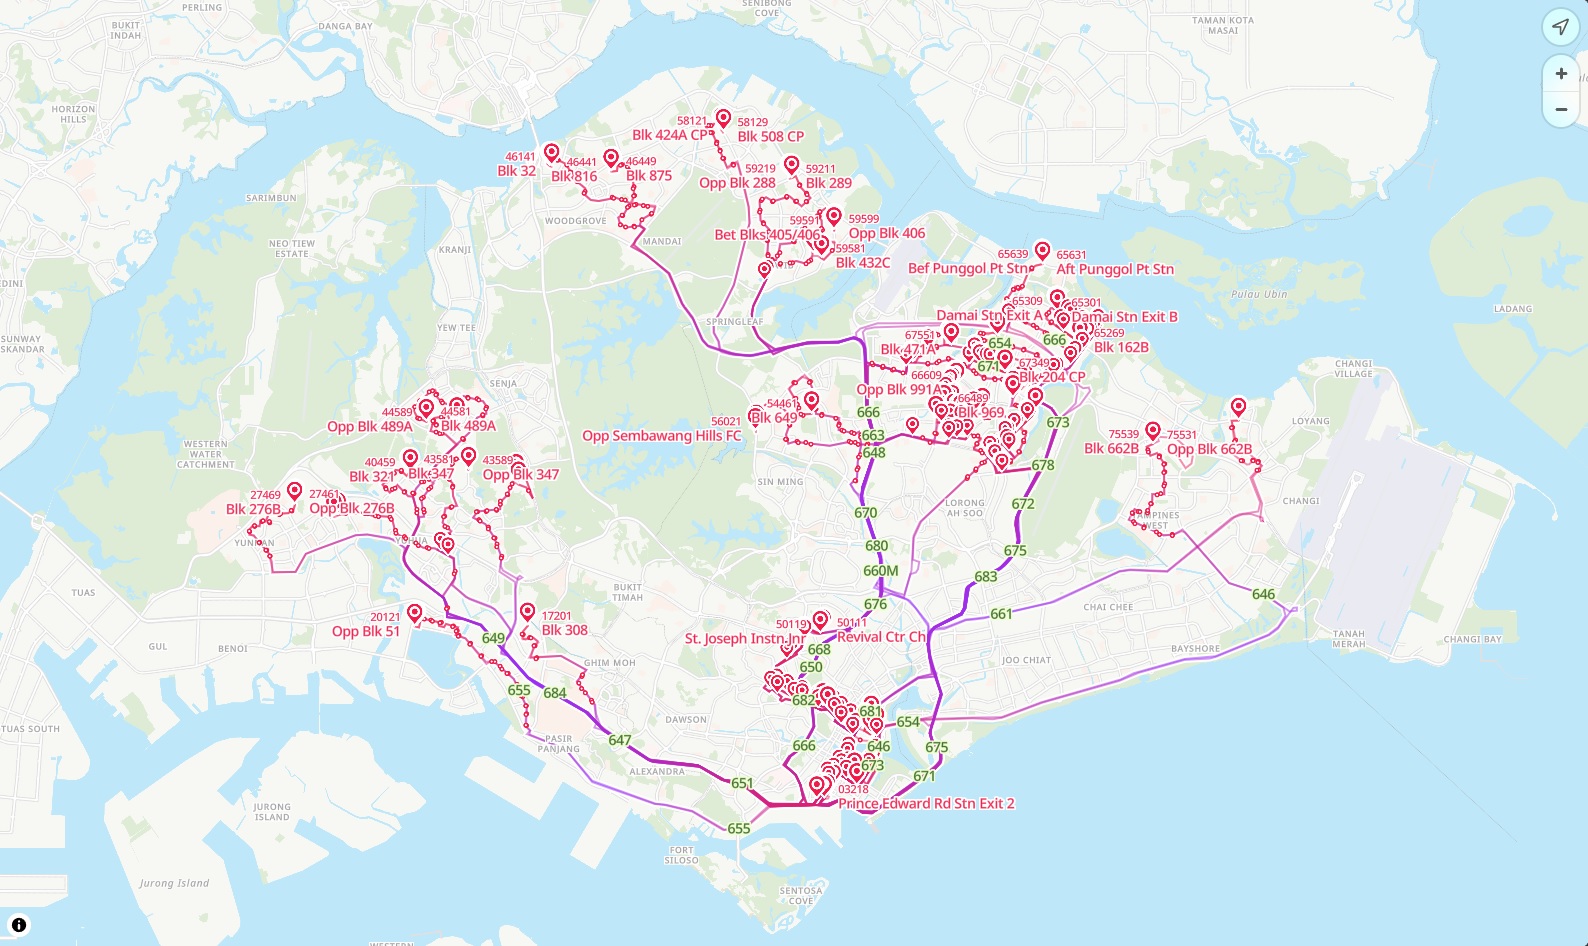
Read together, City Direct expansion is functioning as a form of cross-subsidy: fare and tax revenue funding a loss-making bus service specifically to paper over crowding the rail network cannot otherwise handle at peak. While being a legitimate use of BCM’s risk-transfer model — it is worth naming plainly as a cross-subsidy rather than treating it as simply “good network planning,” since it means part of the bus budget is effectively underwriting a rail-capacity shortfall rather than bus service in its own right.
Accelerating clean energy transition
BCM is the primary mechanism through which LTA is executing the Land Transport Master Plan 2040‘s goal of a 100% cleaner-energy public bus fleet by 2040. Likewise, authorities also publicly committed to a goal of having 1 in 2 public buses be electric by 2030.
Between 2016 and 2026, LTA ran eight rounds of bus procurement (seven open tenders, one closed tender), purchasing 1,801 buses in total — most recently the 660-bus order under Contract PT602. Of those 1,801 buses, 1,140 are electric, procured since 2017.
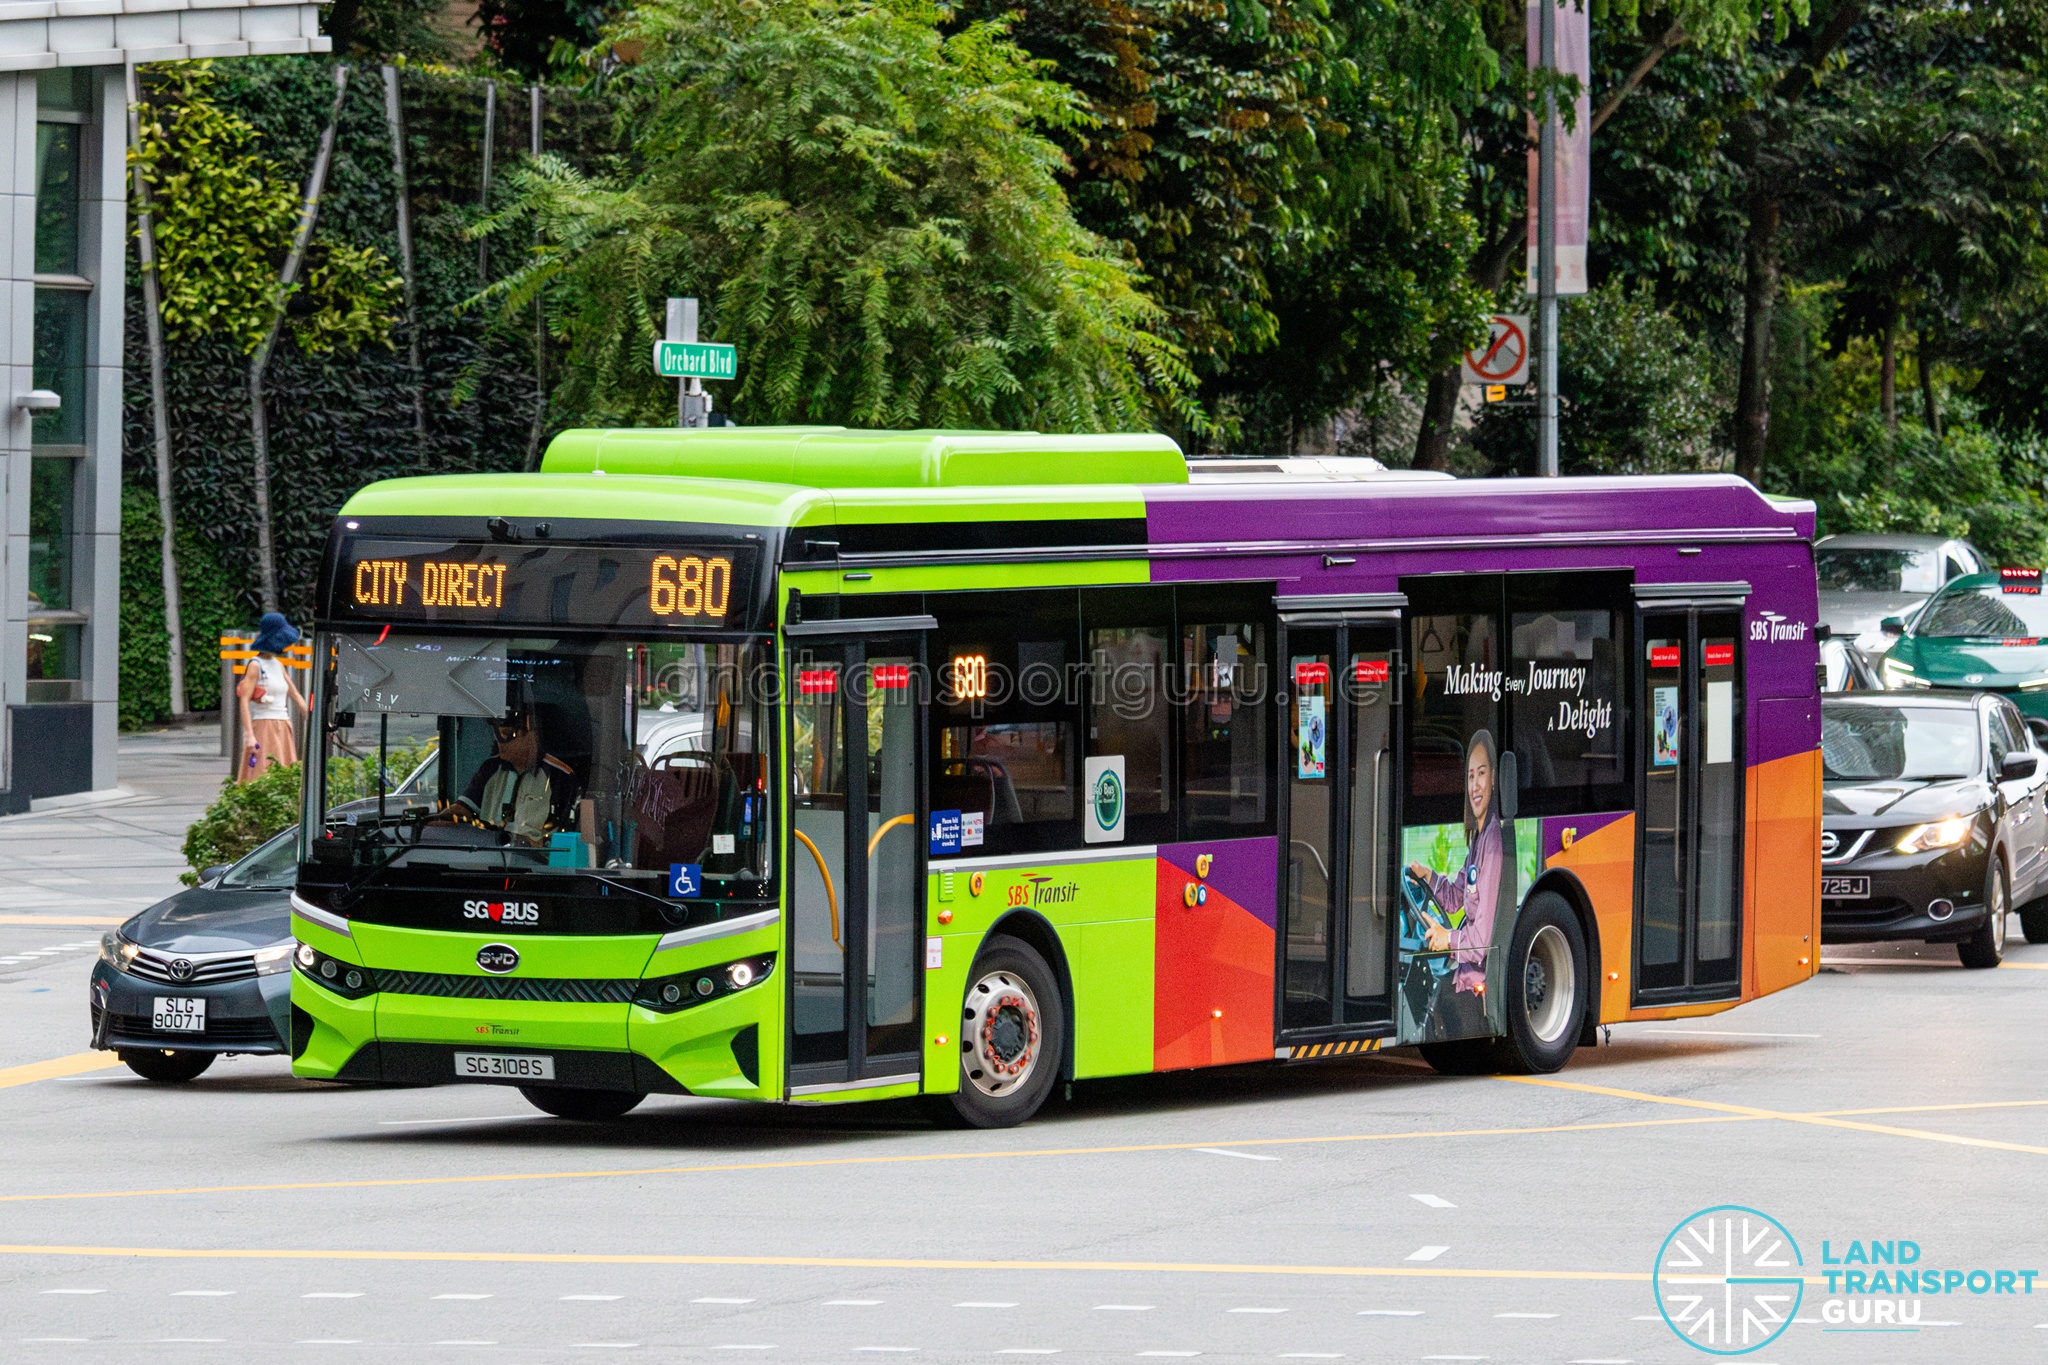
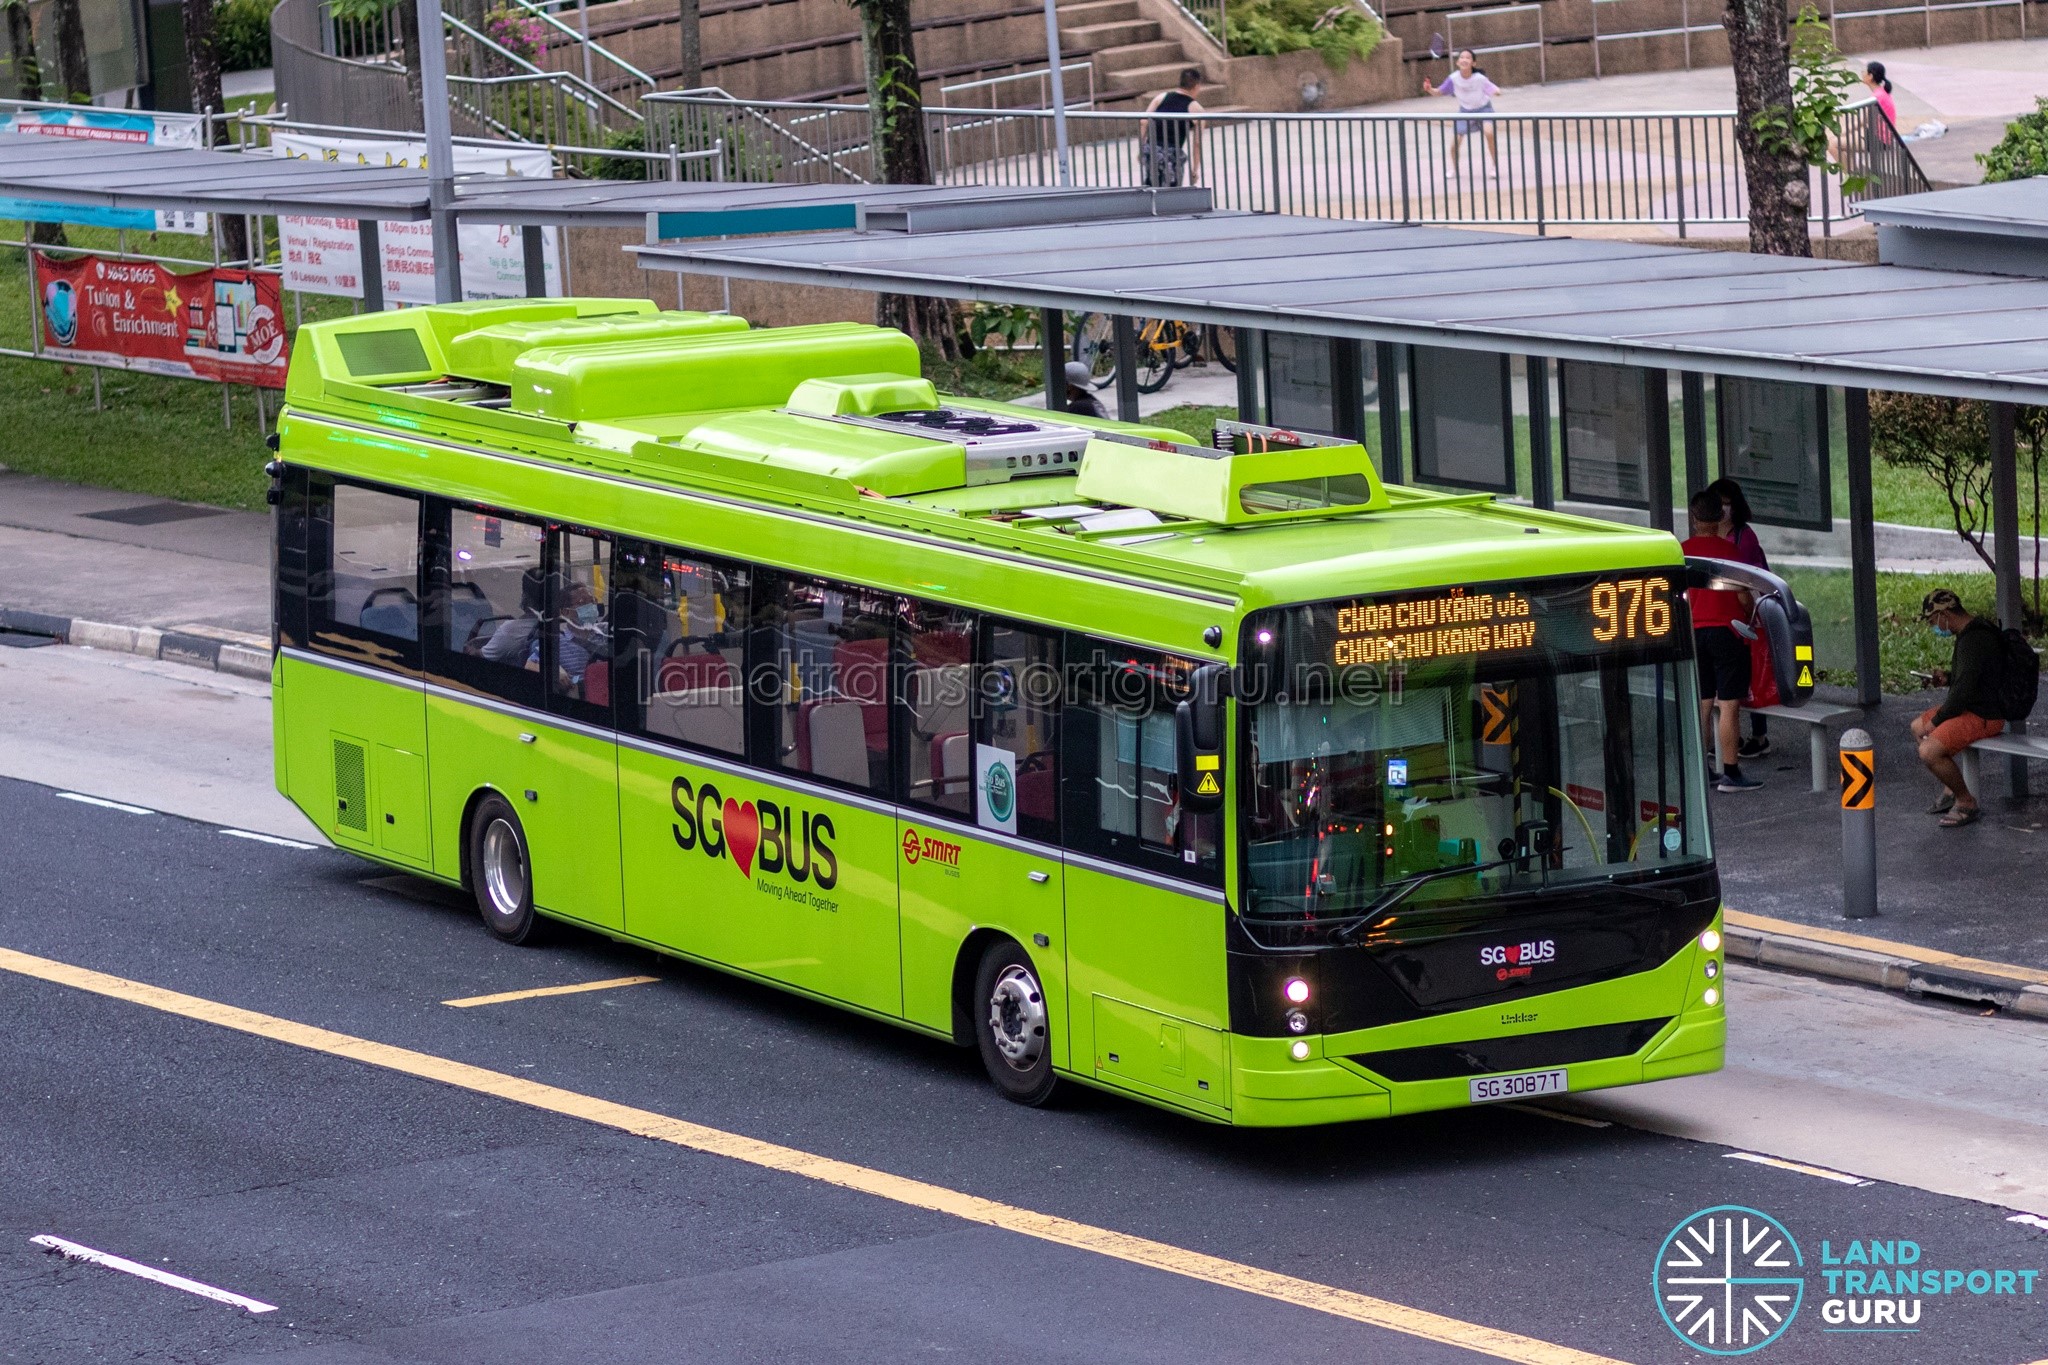

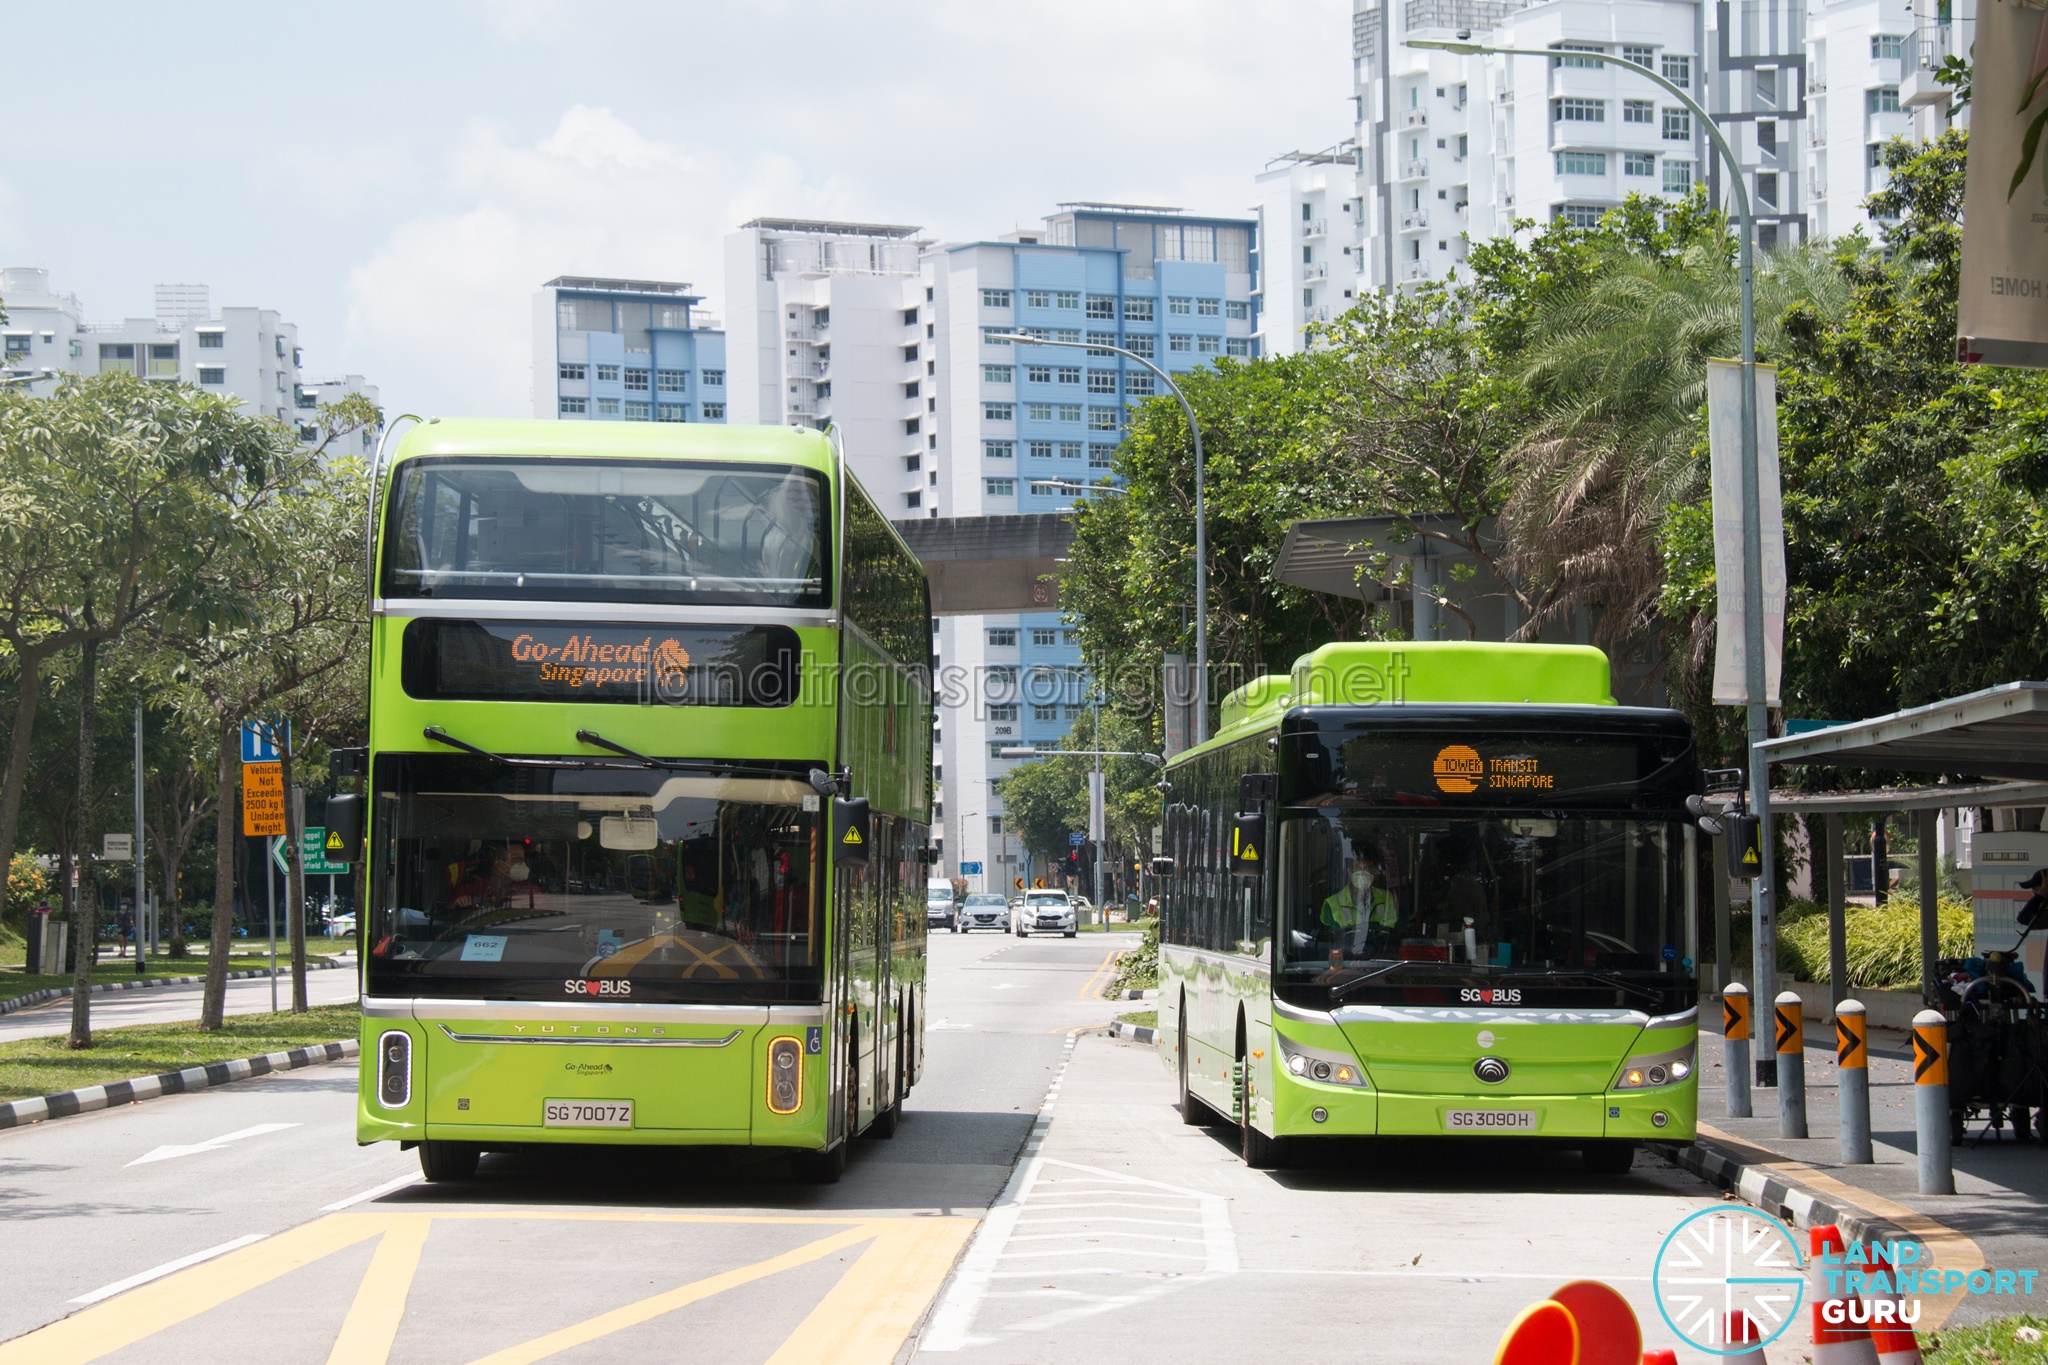
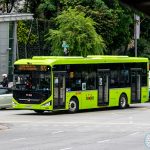
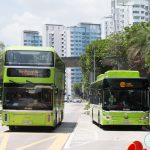
Half the public bus fleet electric by 2030 implies roughly 3,000 electric buses — meaning LTA is currently well under halfway to that midpoint target with under four years to go, and the pace of e-bus procurement will need to accelerate substantially in the next few years to close that gap.
List of LTA electric bus procurements (Click to expand)
| Contract Ref. | Published | Awarded | Buses procured | Quantity | Registration | Awarded to | Contract sum |
| PT323 | 12 Dec 2017 | 24 Oct 2018 | BYD K9 | 20 | SG3050Z – SG3069X | BYD (Singapore) Pte. Ltd. | S$17.25 million |
| Linkker LM312 | 20 | SG3070R – SG3089M | ST Engineering Land Systems Ltd | S$15.15 million | |||
| Yutong E12 | 10 | SG3090H – SG3099J | Yutong-NARI Consortium | S$18.25 million | |||
| Yutong E12DD | 10 | SG7000S – SG7009T | |||||
| PT601 |
27 Mar 2023 | 25 Nov 2023 | BYD BC12A04 | 300 | SG3101K – SG3400Y | BYD (Singapore) Pte. Ltd. | S$108.1 million (sum for 240 units) |
| Zhongtong LCK6126EVG | 120 | SG3401U – SG3520J | Cycle & Carriage Automotive Pte. Ltd. (partnered with Zhongtong Bus) |
S$58.3 million | |||
| PT602 |
14 Mar 2025 | 15 Dec 2025 | CRRC 3-door single-deck electric buses | 100 | — | ST Engineering Mobility Services Pte. Ltd. (partnered with CRRC) |
S$35.7 million |
| BYD 3-door single-deck electric buses | 160 | — | BYD (Singapore) Pte. Ltd. | S$71.3 million | |||
| Yutong 3-door single-deck electric buses | 100 | — | Yutong International Trade Pte. Ltd. – Yutong Bus Co., Ltd Consortium | S$43.9 million | |||
| CRRC 3-door 2-staircase double-deck electric buses | 150 | — | ST Engineering Mobility Services Pte. Ltd. (partnered with CRRC) |
S$79.0 million | |||
| BYD 3-door 2-staircase double-deck electric buses | 50 | — | BYD (Singapore) Pte. Ltd. | S$34.5 million | |||
| Zhongtong 3-door 2-staircase double-deck electric buses | 100 | — | Cycle & Carriage Automotive Pte. Ltd. (partnered with Zhongtong Bus) |
S$57.8 million |
The other side of the coin: rationalisation still happens
While the BCM insulates operators from direct farebox risk, it does not make the bus network immune to service reductions. The LTA regularly conducts bus route rationalisation exercises to optimise resources and reduce network duplication. Historically, these large-scale adjustments were timed alongside the opening of new MRT lines. More recently, however, the approach has shifted toward narrower, targeted interventions aimed at low-ridership sectors. To minimise disruption, the LTA increasingly opts to reduce service frequencies rather than completely withdrawing routes.
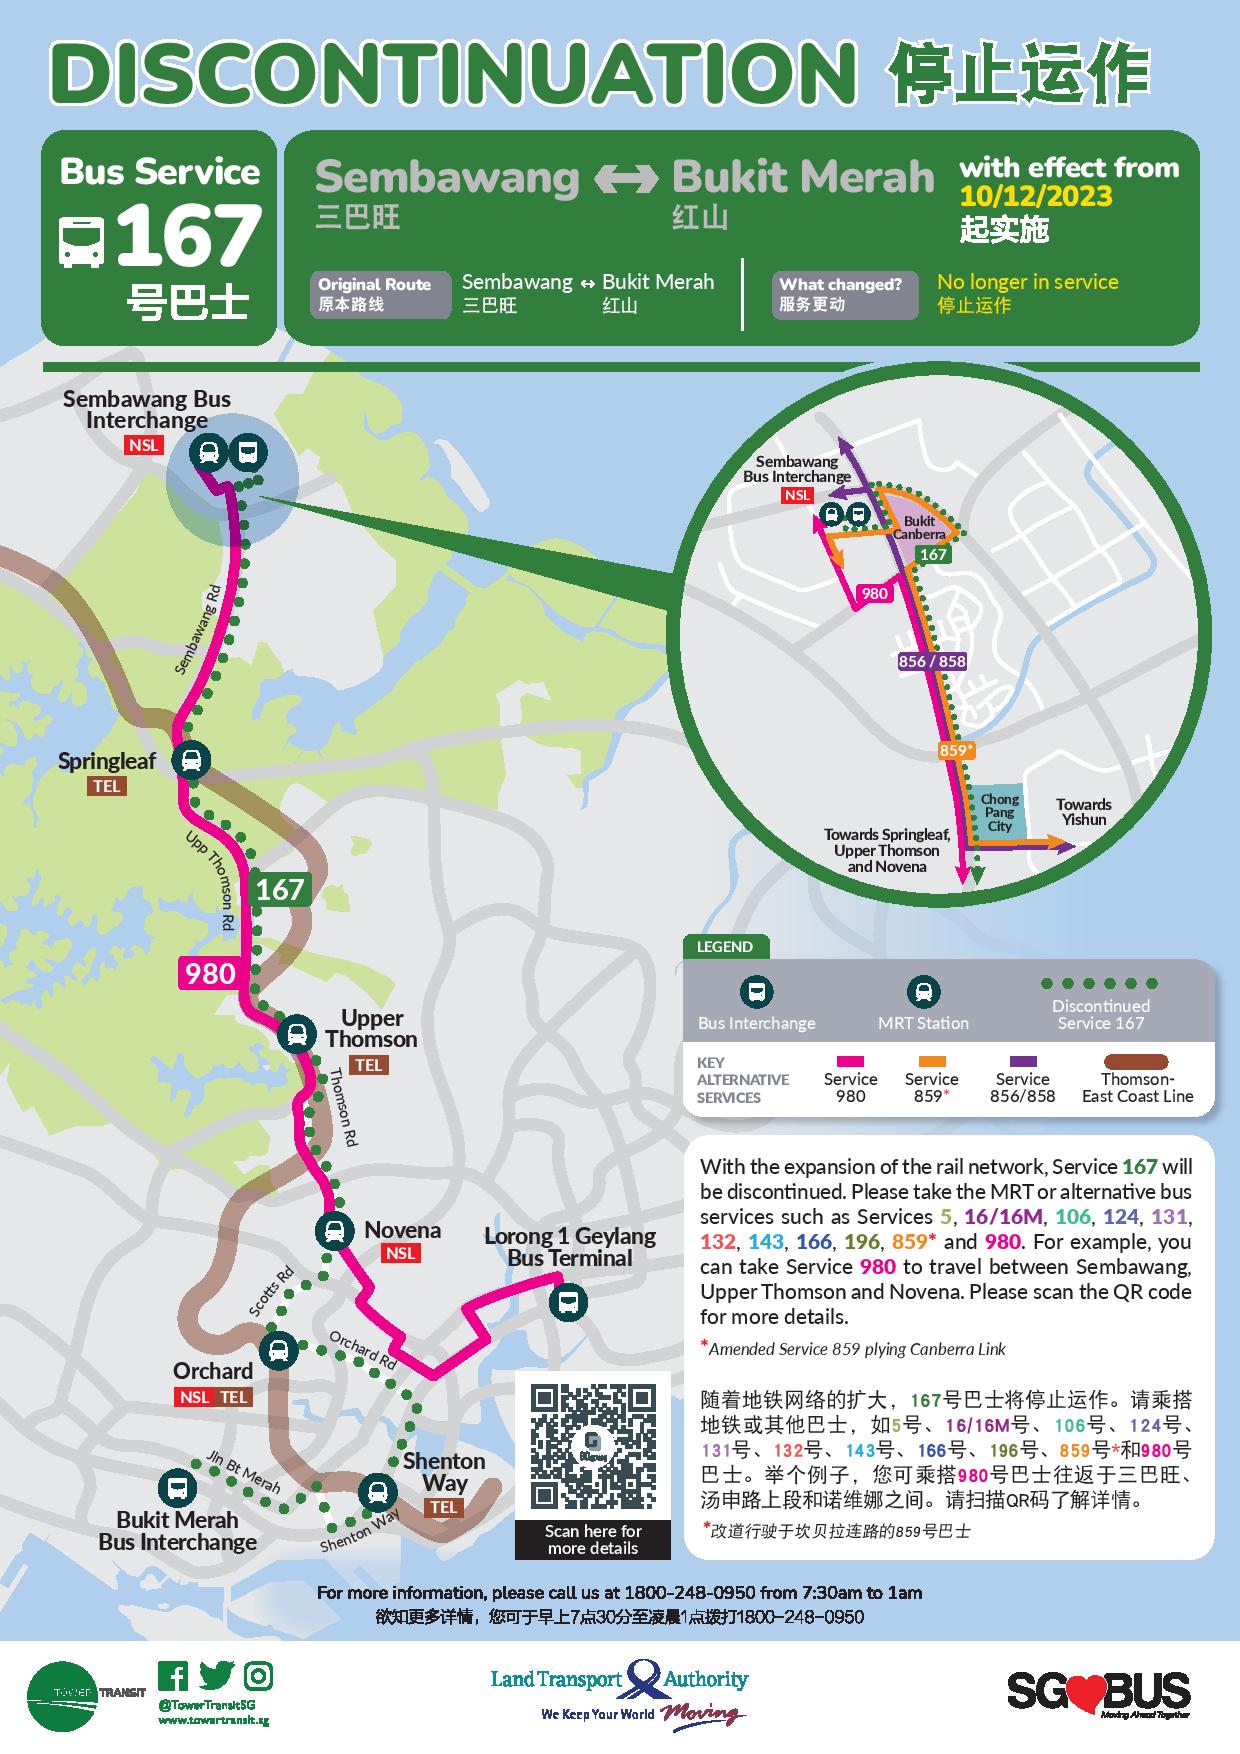
This balance between fiscal discipline and community access is frequently tested by public feedback. A notable example occurred in December 2023, a year after the opening of the Thomson-East Coast Line (TEL) Stage 3. LTA initially announced the complete withdrawal of Service 167 due to falling demand. Following significant public pushback, the LTA reversed its decision, choosing instead to retain the service at a reduced 30-minute frequency. Likewise, LTA tweaked its DTL2 bus rationalisation plans in August 2020 after public concerns.
These interventions highlight an ongoing tension within a centrally planned model. While centralisation allows the state to allocate resources efficiently based on macro-level data, sufficient commuter feedback can still shape network decisions.

![[Withdrawn Poster] Withdrawal of Bus Services 700 & 700A](https://landtransportguru.net/web/wp-content/uploads/2020/08/Aug20_Service-700-700A-Withdrawal-1447x2048.jpg)
![[Updated Poster] Withdrawal of Bus Services 700 & 700A](https://landtransportguru.net/web/wp-content/uploads/2020/08/Aug20_Service-700-700A-Withdrawal_updated-1447x2048.jpg)
Financial sustainability: what the numbers actually show
Finally, this section will explore the financial sustainability of BCM. It must firstly be clarified, before presenting the figures, that a deficit is not, on its own, evidence that BCM is failing. Buses are provided as an essential public service, not run as a commercial enterprise expected to turn a profit.
The public bus network forms part of a coherent land transport policy that actively wants people out of cars, and a permanent structural deficit is the predictable, intended consequence of that policy choice. The point of this section is not to criticise the existence of the deficit. It is to look at what LTA’s own figures say about how that deficit has actually moved over BCM’s first decade, and to draw the conclusions the data itself supports.
The raw figures
| Financial Year | Fare revenue | Bus operating expenditure | Service fees & incentives paid to operators‡ | Deficit before Government grants |
|---|---|---|---|---|
| 2016/17* | $513m | $979m | $848m | –$424m |
| 2017/18 | $832m | $1,770m | $1,520m | –$864m |
| 2018/19 | $834m | $1,925m | $1,654m | –$1,010m |
| 2019/20 | $862m | $1,977m | $1,705m | –$1,022m |
| 2020/21 | $606m | $1,821m | $1,536m | –$1,116m |
| 2021/22 | $643m | $1,945m | $1,650m | –$1,192m |
| 2022/23 | $821m | $1,966m | $1,679m | –$1,025m |
| 2023/24 | $898m | $1,878m | $1,606m | –$852m |
| 2024/25 | $965m | $1,890m | $1,623m | –$787m |
*FY2016/17 covers roughly seven months (September 2016 – March 2017) rather than a full year, reflecting BCM’s actual commencement date — not a genuine 12-month baseline. The financial year for LTA begins on 1 April and ends on 31 March of the following year.
‡Fare revenue minus bus operating expenditure does equal the stated deficit in any year, and that is expected rather than an error: LTA’s operating income also includes bus and bus-related lease income and other operating income beyond fares, while operating expenditure includes several lines beyond service fees — depreciation of property, plant and equipment, interest expense on lease liabilities, employee compensation, IT expenses, and other costs.
The mechanics of the deficit are evident: commuter fare revenue doesn’t come close to covering the combined cost of operating expenditure. A consequence of BCM’s central accounting is fiscal transparency: the true baseline cost of operating Singapore’s bus network is now visible as a single, consolidated headline figure, whereas it was previously distributed across the private accounts of individual bus operators.
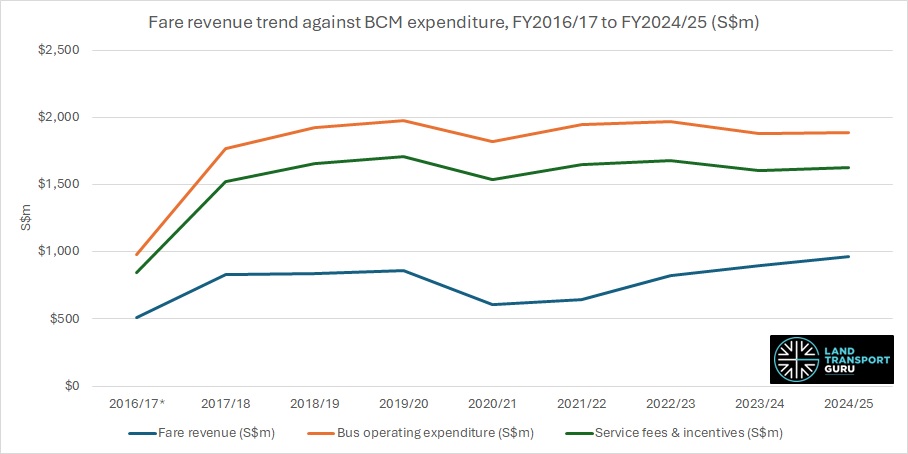
MOT has, at points, cited that headline deficit figure as part of its justification for rationalising underused routes — the same rationalisation trend covered earlier in this piece. That’s a legitimate use of the number. But the same figure could just as easily be misused to argue against maintaining low-usage coverage as a matter of principle, and that argument runs straight into the reason Government took on this financial risk in the first place.
Computed ratios, 2016/17–2024/25
| Financial Year | Farebox cost recovery (fares/opex) | Deficit as % of opex | Service fees as % of opex | YoY Δ service fee | YoY Δ fare revenue |
|---|---|---|---|---|---|
| 2016/17* | 52.4% | 43.3% | 86.6% | — | — |
| 2017/18 | 47.0% | 48.8% | 85.9% | +79.2%† | +62.2%† |
| 2018/19 | 43.3% | 52.5% | 85.9% | +8.8% | +0.2% |
| 2019/20 | 43.6% | 51.7% | 86.2% | +3.1% | +3.4% |
| 2020/21 | 33.3% | 61.3% | 84.3% | –9.9% | –29.7% |
| 2021/22 | 33.1% | 61.3% | 84.8% | +7.4% | +6.1% |
| 2022/23 | 41.8% | 52.1% | 85.4% | +1.8% | +27.7% |
| 2023/24 | 47.8% | 45.4% | 85.5% | –4.3% | +9.4% |
| 2024/25 | 51.1% | 41.6% | 85.9% | +1.1% | +7.5% |
†2017/18’s YoY figures are inflated by comparison against the partial FY2016/17 base year (September 2016 – March 2017) and should not be read as genuine growth rates.
What the trend reveals
1. BCM’s robust risk-transfer works under stress
The BCM’s core financial mechanism—transferring ridership risk from operators to the Government—successfully withstood its first major macroeconomic shock during the COVID-19 pandemic. Fare revenue collapsed by 29.7% in FY2020/21, but despite this sharp decline, service fees LTA paid out to bus operators fell by just 9.9%.
Bus operators thus remained insulated from a severe demand shock that would have caused widespread financial distress under the pre-2016 commercial licensing model.
2. Deficit has followed a boom-bust-recovery arc
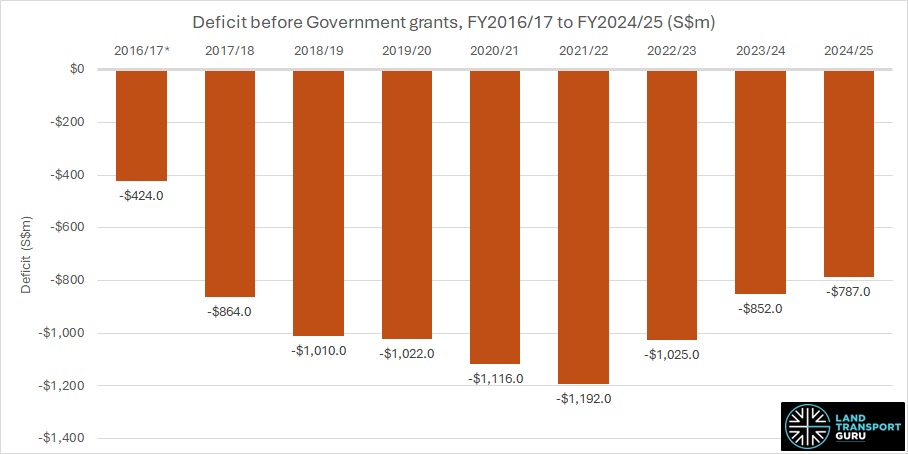
Rather than experiencing an unmitigated fiscal decline, the national bus deficit has followed an arc of stabilisation and recovery.
The operating deficit expanded from approximately S$864 million in the BCM’s first full year to over S$1 billion in FY2018/19, triggering concerns over BCM’s financial sustainability, and eventually peaking at S$1.192 billion in FY2021/22 as pandemic fare revenue bottomed out.
Over the subsequent three fiscal years, the deficit narrowed progressively, recovering to S$787 million by FY2024/25. This represents the lowest raw deficit in the recent nine-year series.
Evaluated as a percentage of overall network opex, the FY2024/25 deficit dropped to a series-low of 41.6%. Concurrently, the farebox recovery ratio rebounded from its pandemic low of 33.1% to 51.1% in FY2024/25, confirming a genuine financial recovery.
Stabilisation Drivers and Subsidies
This financial stabilisation was aided by regulatory interventions by the Public Transport Council (PTC) and direct Government intervention.
Firstly, in April 2023, the PTC amended its fare adjustment formula to mitigate volatility. Volatile components—specifically the ridership-linked Network Capacity Factor and the Productivity Extraction—were replaced by a fixed 1.1% Capacity Adjustment Factor and a 0.1% Productivity Contribution, locked in from 2023 through 2027.
The PTC also implemented consecutive fare increases to realign revenue with macroeconomic cost pressures, granting a 7.0% increase at the Fare Review Exercise (FRE) 2023, 6.0% at FRE 2024, and 5.0% at FRE 2025. This resulted in a cumulative fare increase of approximately 19% over a three-year period.
To shield commuters from sudden cost spikes, the PTC also consistently deferred the full “maximum allowable” formula outputs (deferring 15.6% in 2023, 12.9% in 2024, and 9.4% in 2025). The Government absorbed these deferred amounts through targeted operational subsidies to close the funding gap.
3. Operator payments dominate the cost base
The baseline expenditure data highlights that operator payouts remain the single largest driver of the network’s cost structure, while LTA’s administrative overhead has stabilised.
| Cost Component | Proportion of Total Opex | Primary Drivers & Allocations (Based on FY2024/25) [Link] |
| Operator Service Fees & Incentives | 84% – 87% (Consistent across all years) |
Direct payments to transport operators for service execution, performance milestones, and baseline network maintenance. |
| LTA Administrative & Infrastructure Overhead | 13% – 16% (Consistent across all years) | Totaling S$267 million in FY2024/25, explicitly allocated as:
|
These figures ground an important structural reality of the BCM: central asset ownership carries an ongoing, multi-million dollar fixed cost. While this asset-holding overhead is dominated almost entirely by vehicle and facility depreciation, it remains a modest and stable component in contrast to the primary outlays required to fund day-to-day operations.
4. Advertising contributes only modestly to the structural deficit
LTA had appointed Moove Media in 2025 as sole concessionaire to manage advertising across all public buses and bus interchanges, a deal expected to recover roughly $150 million in concession fees over its seven-year term — around $21 million a year. Set against an annual deficit that has run between roughly $787 million and $1.192 billion across the years above, it represents a genuine but modest contribution: at most, advertising revenue covers a low single-digit percentage of the yearly shortfall.
Future Commitments Could Reverse the BCM Deficit Trend
While financial data from FY2024/25 shows a narrowing deficit for the Bus Contracting Model (BCM), it is premature to assume this trend will continue. Two major, long-term spending commitments are currently phasing into the system and will likely pressure the cost base in the coming years.
First, the Bus Connectivity Enhancement Programme (BCEP) introduces $900 million in government funding between 2024 and 2032. Although structured as capital investment, the new routes and increased frequencies add permanent operational costs. Second, the bus captain wage intervention announced in June 2026 introduces an open-ended financial commitment. The government’s direct subsidy depends entirely on industry recruitment rates rather than a fixed budget, while the Land Transport Authority (LTA) has not disclosed the terms under which operators must absorb wage increases for existing drivers.
Both of these are positive developments in their own right, representing investment in improving service quality and in a workforce currently under strain. But because BCEP spending is ramping up and the wage increases only take effect in January 2027, their full financial impact will only appear in FY2026/27 and beyond. Consequently, the recent deficit reduction may plateau or reverse. Maintaining both high investment and a shrinking deficit will require fare revenue and ridership to grow at a pace fast enough to offset these rising costs.
A Decade of the Bus Contracting Model: The Verdict
Ten years after implementation, the BCM has achieved its primary institutional goal. By shifting network planning, asset ownership, and financial risk to the state, the model delivered tangible improvements in service reliability, fleet accessibility, and technology. However, structural challenges remain. Industry competition is narrower than initially expected, performance data and incentive data remain hidden from public scrutiny, and workforce shortages have forced direct government intervention.
Financially, the model proved resilient under stress, successfully protecting operators from severe revenue losses during the pandemic. Ultimately, the long-term success of the BCM may depend less on further state control, and more on whether the government extends transparent public disclosure to its remaining blind spots, particularly regarding tendering decisions and performance data.
What are your thoughts on the evolution of the Bus Contracting Model?
Share your views in the comments below.
For the time being until Bt Merah move to Pasir Panjang and Ulu Pandan Integrated depot ready, UP should take control of all Buona Vista, Ghim Moh and retain Kent Ridge svc. Partial svc like 30,51,52,154,157,174,197 and 506 should be BBD.
Boon Lay svc like 30,154,157 and 174 should continue to park at Bulim. Half of 99 fleets should also park at Bulim. 99 should be full BBD control. 174 partial BBD UPD.